
Reason to trust
How Our News is Made
Strict editorial policy that focuses on accuracy, relevance, and impartiality
Ad discliamer
Morbi pretium leo et nisl aliquam mollis. Quisque arcu lorem, ultricies quis pellentesque nec, ullamcorper eu odio.
Key Highlights
- Ripple price surged higher and settled above the 0.5000 resistance against the US dollar.
- There is a short-term connecting bearish trend line in place with resistance at 0.6000 on the hourly chart of the XRP/USD pair (data source from Kraken).
- The pair may break the $0.6000 level in the near term to test the 0.6800 zone.
Ripple price is placed in a positive zone against the US Dollar and Bitcoin. XRP/USD needs to clear $0.6000 and $0.6800 to accelerate gains.
Ripple Price Analysis
This past week, we saw a nasty upward move from the $0.3500 low in Ripple price against the US Dollar. The XRP/USD pair even surpassed the $0.5200 target and traded towards the $0.8000 level. A new monthly high was formed at $0.7972 before the price started a downside correction. The price declined and traded towards the $0.5000 support. A low was formed at $0.4912 and later the price started consolidating losses.
It corrected higher and traded above the $0.5500 level. There was also a break above the 23.6% fib retracement level of the last decline from the $0.7972 high to $0.4912 low. However, the upside move faced sellers near the $0.6000 and $0.6200 levels. There is also a short-term connecting bearish trend line in place with resistance at 0.6000 on the hourly chart of the XRP/USD pair. A break above the trend line could push the price towards 0.6440. It represents the 50% fib retracement level of the last decline from the $0.7972 high to $0.4912 low. On the downside, the $0.5000 level is a decent support along with the 100 hourly simple moving average.
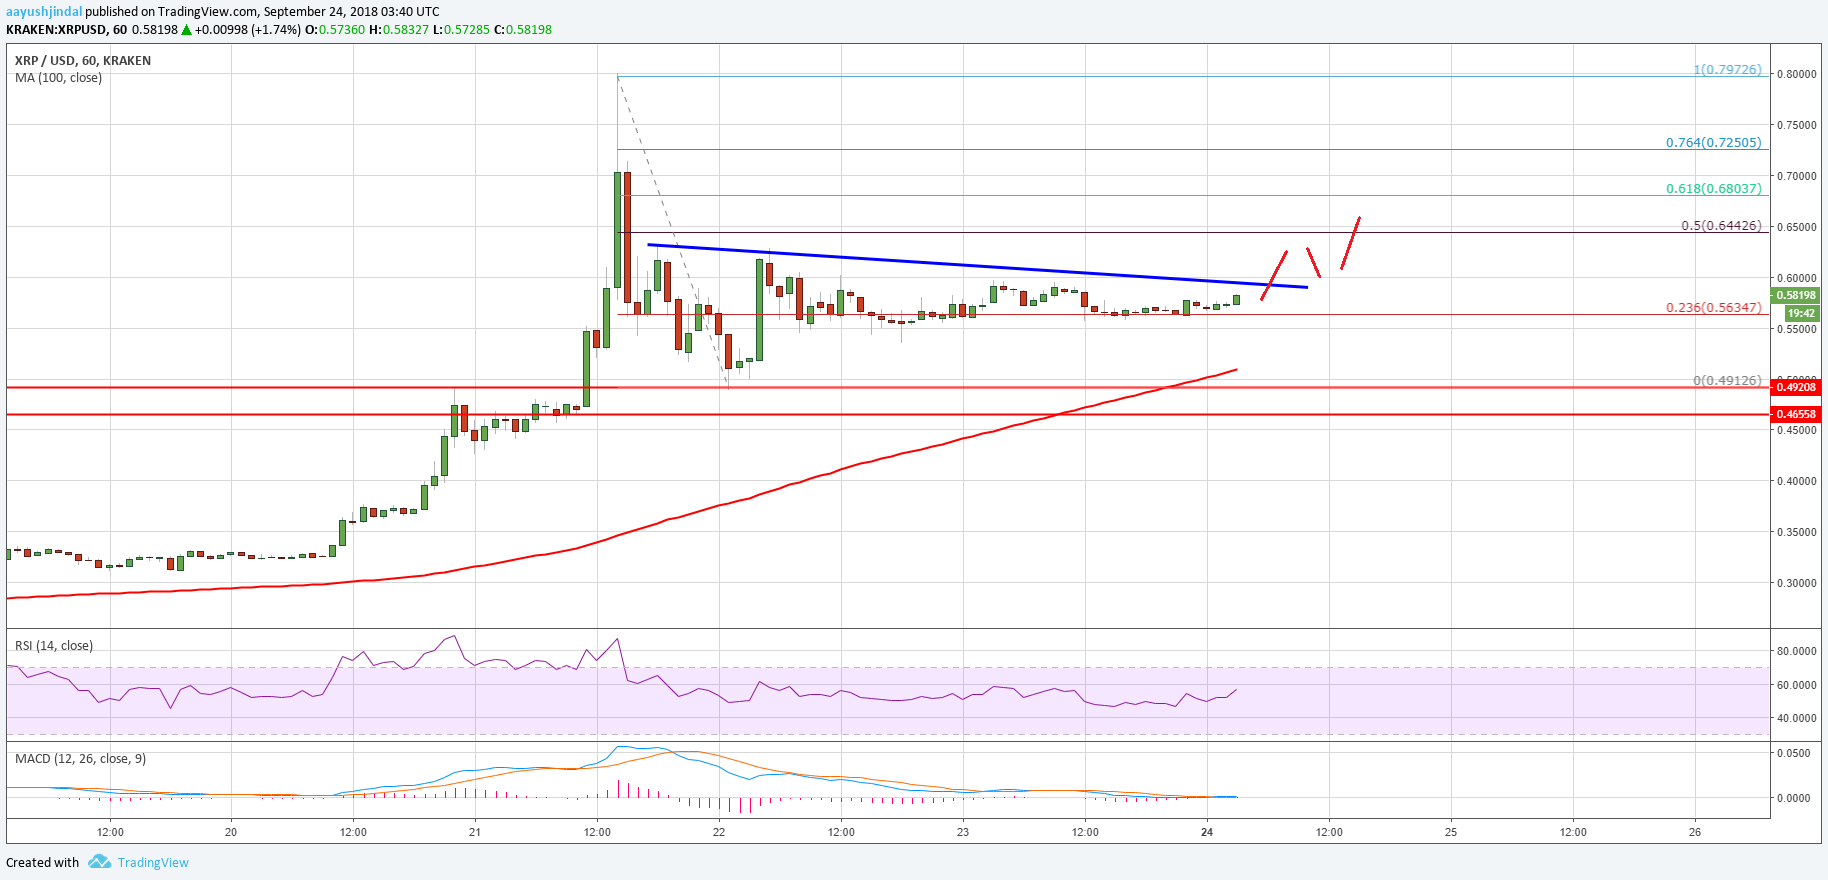
Looking at the chart, ripple price could break the $0.6000 resistance in the short term. However, a push above the $0.6800 is needed for a retest of the $0.7950-0.8000 zone.
Looking at the technical indicators:
Hourly MACD – The MACD for XRP/USD is flat in the bullish zone.
Hourly RSI (Relative Strength Index) – The RSI for XRP/USD is above the 50 level.
Major Support Level – $0.5000
Major Resistance Level – $0.6000


