
Reason to trust
How Our News is Made
Strict editorial policy that focuses on accuracy, relevance, and impartiality
Ad discliamer
Morbi pretium leo et nisl aliquam mollis. Quisque arcu lorem, ultricies quis pellentesque nec, ullamcorper eu odio.
Key Highlights
- Ripple price declined sharply and traded towards the $0.3250 level against the US dollar.
- This week’s followed key bearish trend line is still active with resistance at $0.3420 on the hourly chart of the XRP/USD pair (data source from Kraken).
- The pair is likely to face a lot of hurdles near the $0.3420, $0.3465 and $0.3500 levels.
Ripple price traded to new weekly lows against the US Dollar and Bitcoin. XRP/USD is likely to struggle to break the $0.3465 and $0.3500 resistance levels.
Ripple Price Analysis
There were further declines in ripple price below the $0.3600 support level against the US Dollar. The XRP/USD pair broke the $0.3405 support level to trade to a new weekly low. Sellers pushed the price below the $0.3300 level and the 100 hourly simple moving average. A low was formed at $0.3241 and later the price bounced back above $0.3300. It broke the 23.6% Fib retracement level of the recent decline from the $0.3601 high to $0.3241 low.
However, the current recovery is facing a solid resistance near the $0.3400 level, which was a support earlier. Besides, this week’s followed key bearish trend line is still active with resistance at $0.3420 on the hourly chart of the XRP/USD pair. An upside break above the $0.3420 level may push the price towards the key $0.3500 resistance. An intermediate resistance is positioned at $0.3465. It coincides with the 61.8% Fib retracement level of the recent decline from the $0.3601 high to $0.3241 low. Therefore, if the price moves higher, it could face a lot of hurdles near the $0.3420, $0.3465 and $0.3500 levels.
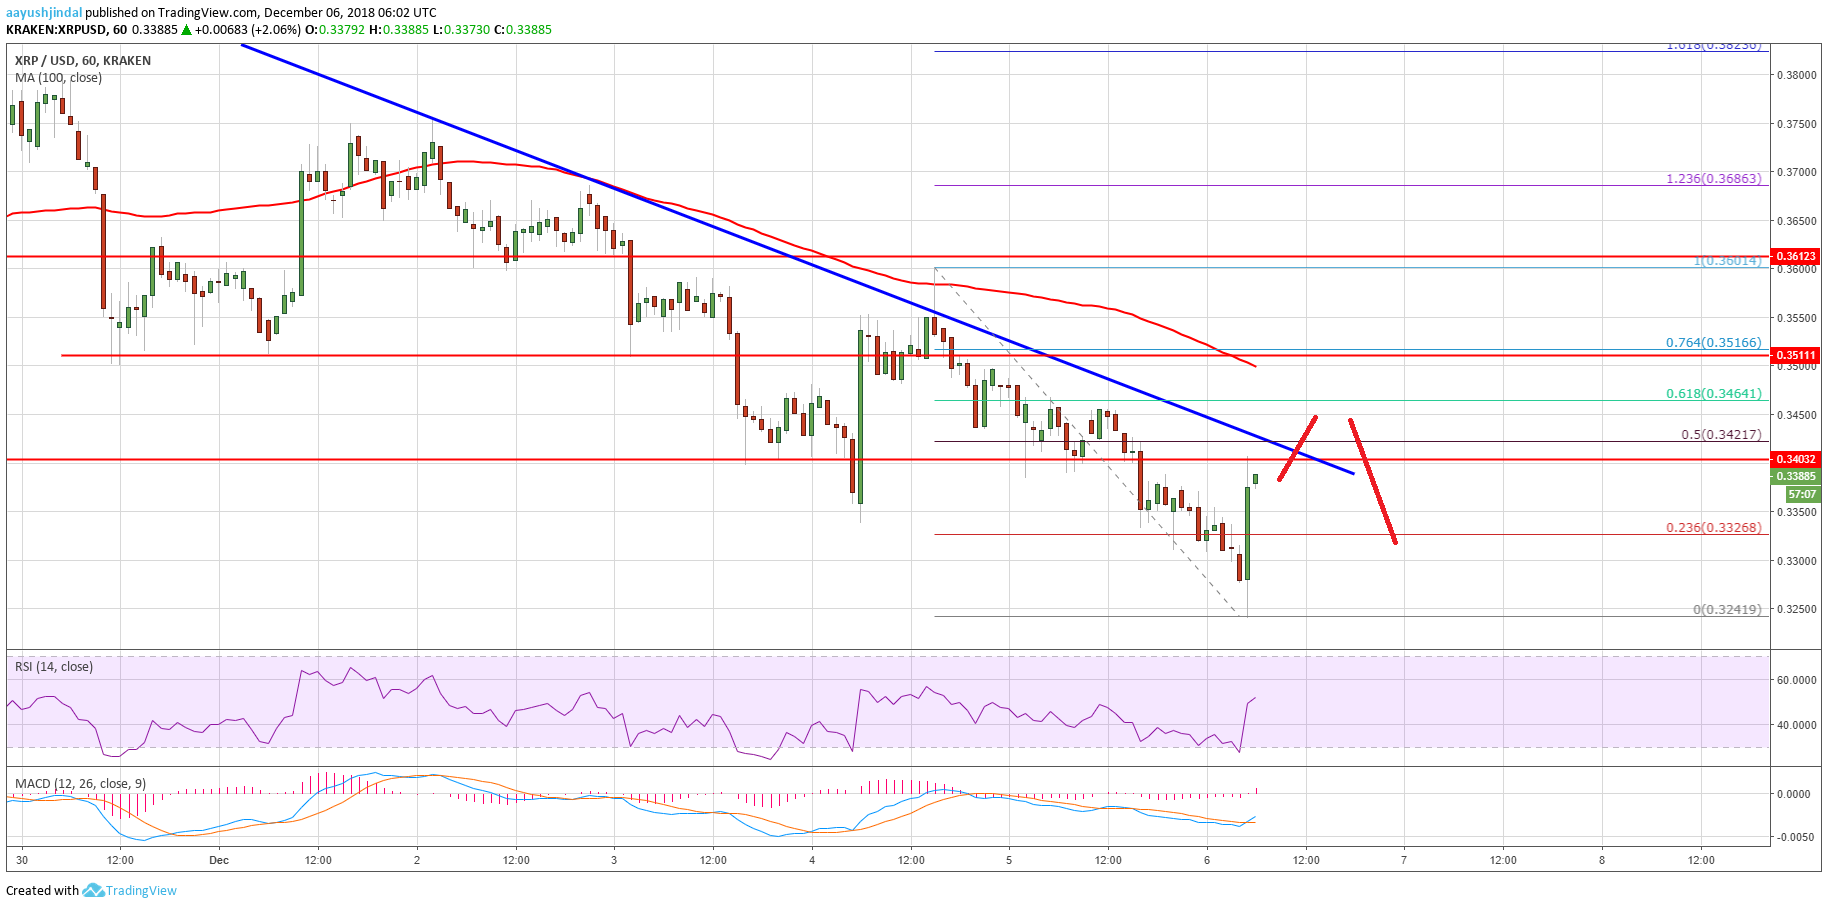
Looking at the chart, ripple price is still in a downtrend as long as below $0.3500 and the 100 hourly SMA. On the downside, a break below $0.3250 could push the price towards $0.3180 or $0.3120.
Looking at the technical indicators:
Hourly MACD – The MACD for XRP/USD moved back in the bullish zone.
Hourly RSI (Relative Strength Index) – The RSI for XRP/USD jumped above the 50 level.
Major Support Level – $0.3250
Major Resistance Level – $0.3500


