
Reason to trust
How Our News is Made
Strict editorial policy that focuses on accuracy, relevance, and impartiality
Ad discliamer
Morbi pretium leo et nisl aliquam mollis. Quisque arcu lorem, ultricies quis pellentesque nec, ullamcorper eu odio.
Key Highlights
- Ripple price declined heavily and broke the $0.4860 and $0.4400 support levels against the US dollar.
- There is a crucial bearish trend line formed with resistance at $0.4720 on the hourly chart of the XRP/USD pair (data source from Kraken).
- The pair is struggling to recover above the $0.4600 and $0.4700 resistance levels.
Ripple price fell sharply below key levels against the US Dollar and Bitcoin. XRP/USD is correcting higher, but it remains sell on rallies near $0.4700.
Ripple Price Analysis
The past three sessions were destructive as there was a sharp decline from the $0.5100 high in ripple price against the US Dollar. The XRP/USD pair nosedived and broke the $0.5000, $0.4860, $0.4600 and $0.4400 support levels. The price traded close to the $0.4000 level and settled below the 100 hourly simple moving average. The decline found support at $0.4010 and a low was formed at $0.4017.
Later, the price recovered and moved above the $0.4500 level. There was a break above the 23.6% Fib retracement level of the recent drop from the $0.5255 high to $0.4017 low. However, the upside move was protected by the $0.4600 level, which was a support earlier. Besides, the price failed near the 50% Fib retracement level of the recent drop from the $0.5255 high to $0.4017 low. More importantly, there is a crucial bearish trend line formed with resistance at $0.4720 on the hourly chart of the XRP/USD pair. The current market sentiment is bearish and it seems like the price may decline once again towards $0.4200 and $0.4100.
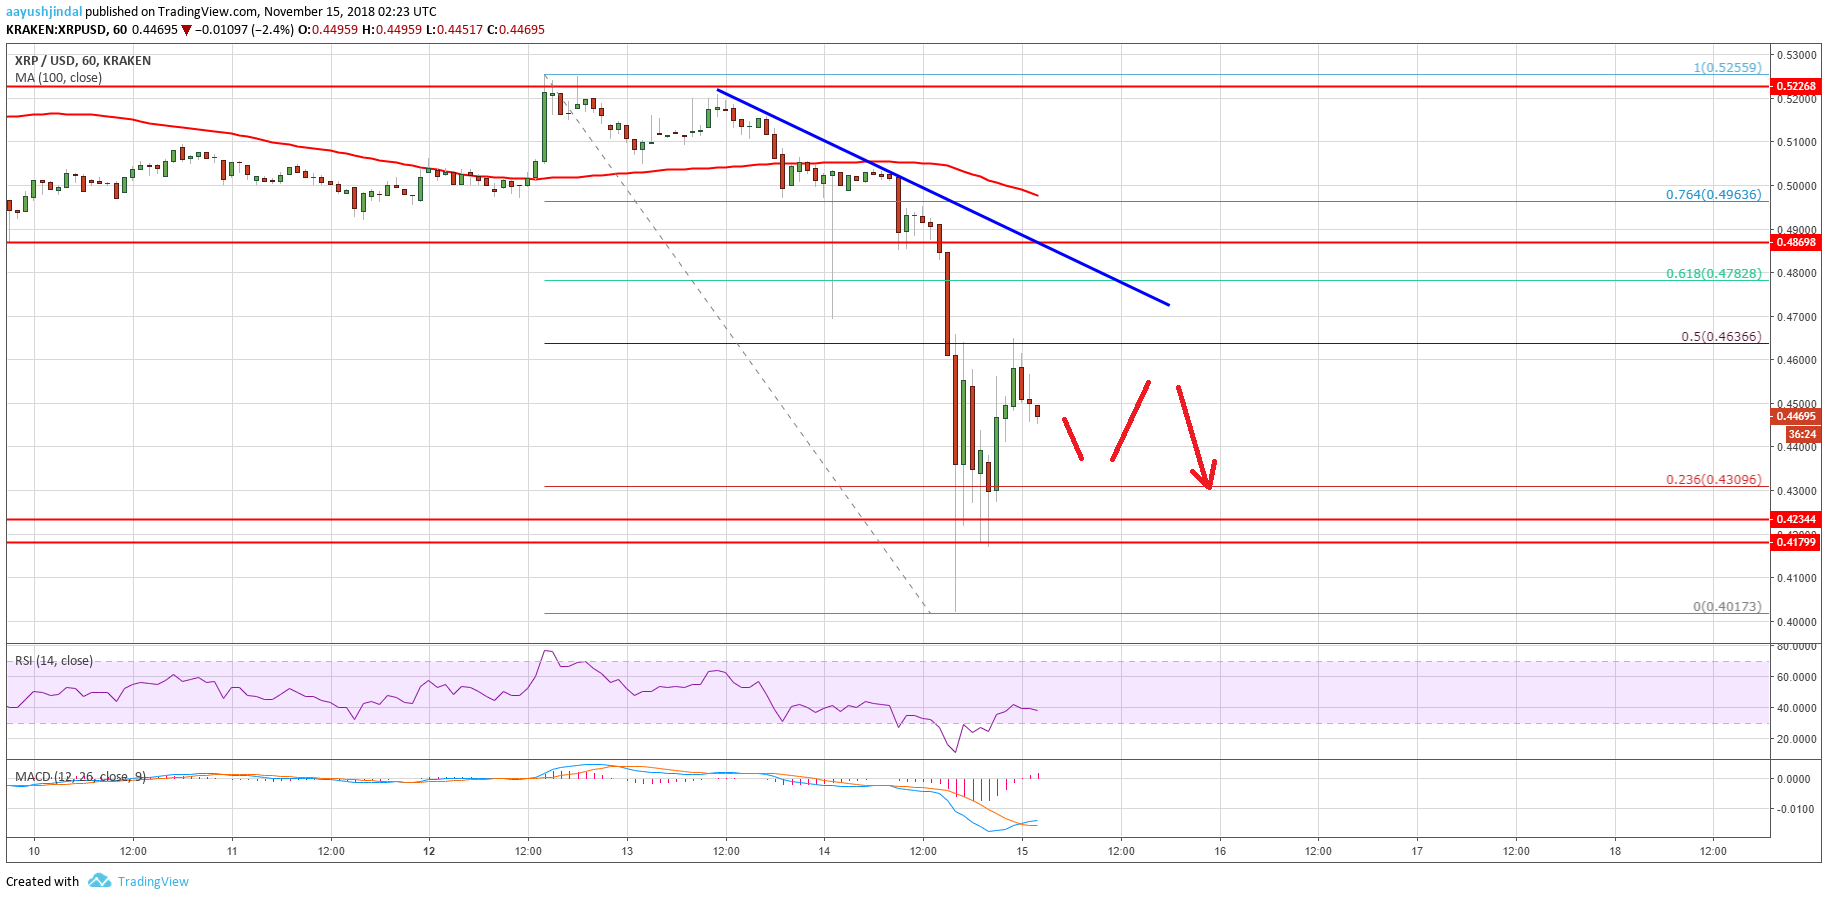
Looking at the chart, ripple price is struggling to recover above $0.4600 and $0.4700. As long as the price is below the $0.4750 pivot level, it could resume it decline in the near term.
Looking at the technical indicators:
Hourly MACD – The MACD for XRP/USD is slowly recovering in the bullish zone.
Hourly RSI (Relative Strength Index) – The RSI for XRP/USD is currently near the 40 level.
Major Support Level – $0.4200
Major Resistance Level – $0.4700


