
Reason to trust
How Our News is Made
Strict editorial policy that focuses on accuracy, relevance, and impartiality
Ad discliamer
Morbi pretium leo et nisl aliquam mollis. Quisque arcu lorem, ultricies quis pellentesque nec, ullamcorper eu odio.
Key Highlights
- Ripple price is placed nicely above the $0.3700 and $0.3615 support levels against the US dollar.
- Yesterday’s highlighted crucial ascending channel is intact with support at $0.3620 on the hourly chart of the XRP/USD pair (data source from Kraken).
- The pair remains supported on dips and it could continue to move higher towards $0.4000 and $0.4200.
Ripple price is positioned nicely for more gains against the US Dollar and Bitcoin. XRP/USD is likely to accelerate gains towards the $0.4200 level in the near term.
Ripple Price Analysis
Yesterday, we saw a nice upward move above the $0.3900 resistance in ripple price against the US Dollar. The XRP/USD pair even spiked above the $0.4000 resistance and traded as high as $0.4014. Later, there was a downside correction and the price traded below the $0.3900 and $0.3850 levels. However, the price remained well supported above the $0.3600 support and the 100 hourly simple moving average.
A low was formed at $0.3669 and later the price started trading in a range. It slowly moved higher and traded above the $0.3700 level. There was a break above the 23.6% Fib retracement level of the recent decline from the $0.4014 high to $0.3669 low. Besides, the price broke a connecting bearish trend line with resistance at $0.3750 on the hourly chart of the XRP/USD pair. It seems like the pair could continue to move higher towards $0.4000 or $0.4200. An immediate resistance is near the $0.3880 level. It represents the 61.8% Fib retracement level of the recent decline from the $0.4014 high to $0.3669 low.
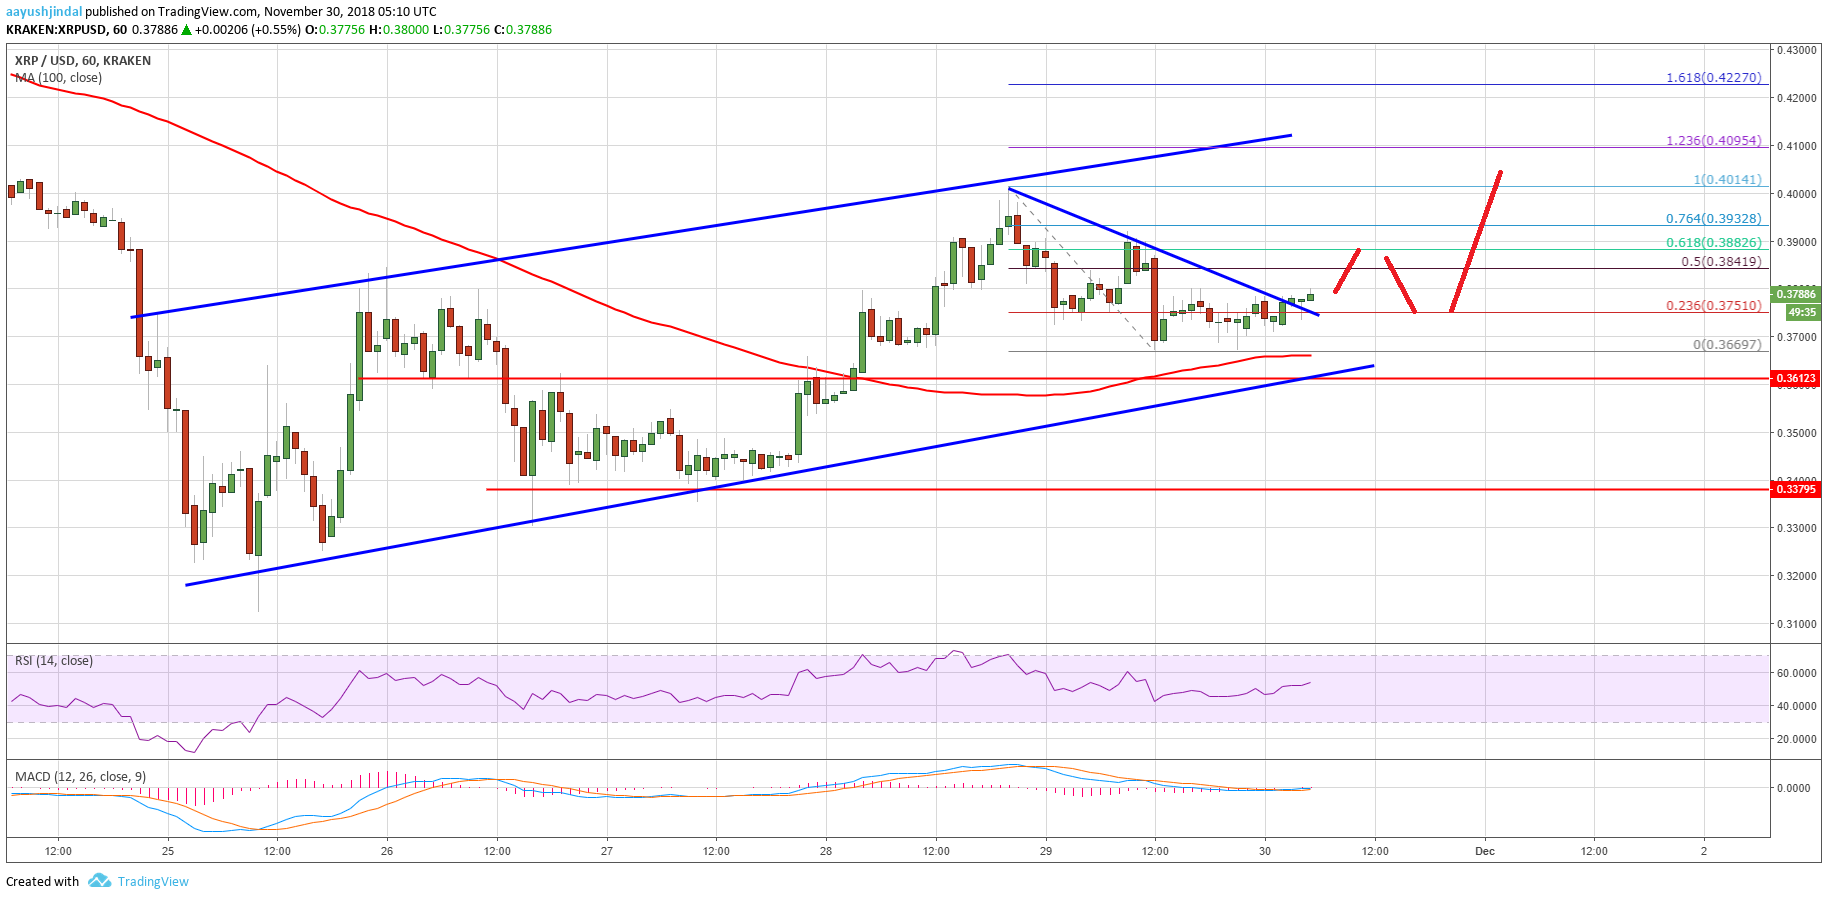
Looking at the chart, ripple price is still following yesterday’s highlighted crucial ascending channel with support at $0.3620. As long as there is no close below $0.3600, the price may continue to grind higher.
Looking at the technical indicators:
Hourly MACD – The MACD for XRP/USD is slightly placed in the bullish zone.
Hourly RSI (Relative Strength Index) – The RSI for XRP/USD is back above the 50 level.
Major Support Level – $0.3620
Major Resistance Level – $0.4000


