
Reason to trust
How Our News is Made
Strict editorial policy that focuses on accuracy, relevance, and impartiality
Ad discliamer
Morbi pretium leo et nisl aliquam mollis. Quisque arcu lorem, ultricies quis pellentesque nec, ullamcorper eu odio.
Key Highlights
- Ripple price recovered nicely and moved above the $0.4500 and $0.4600 resistances against the US dollar.
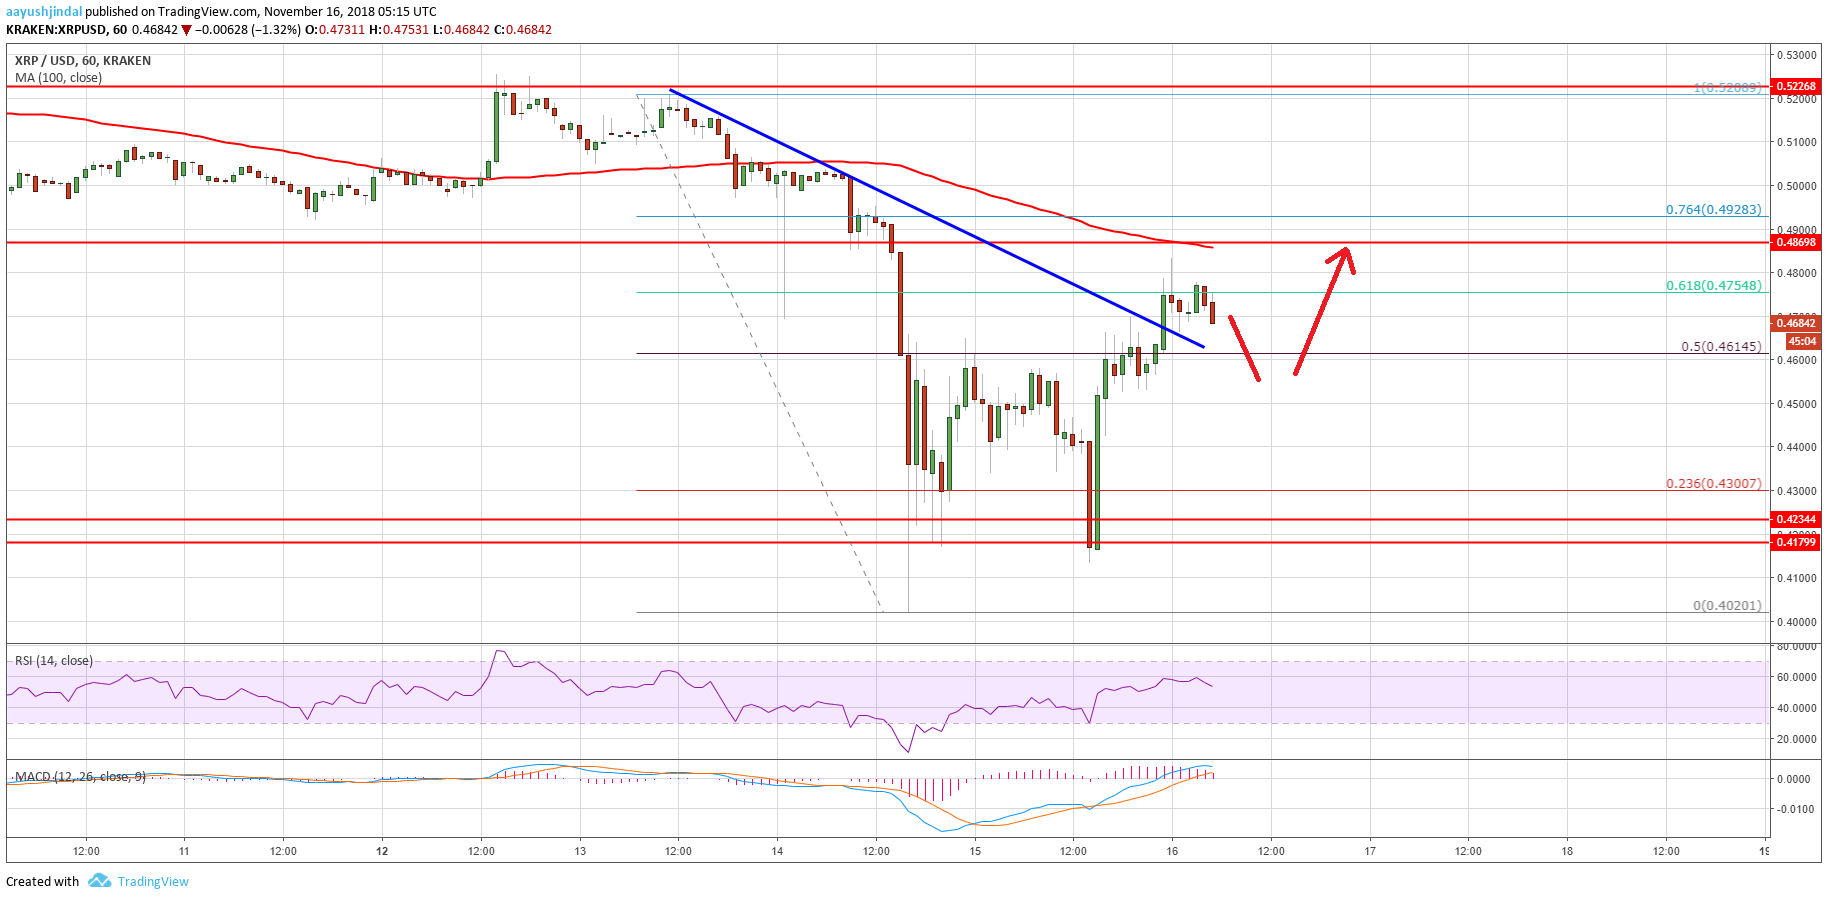
- Yesterday’s highlighted key bearish trend line with resistance at $0.4660 was breached on the hourly chart of the XRP/USD pair (data source from Kraken).
- The pair will most likely face a strong selling interest near the $0.4860 and $0.4900 resistances.
Ripple price managed to correct higher against the US Dollar and Bitcoin. However, XRP/USD is likely to struggle near $0.4900 and the 100 hourly SMA.
Ripple Price Analysis
Yesterday, we saw a nasty decline in ripple price below the $0.5000 support against the US Dollar. The XRP/USD pair broke the $0.4600, $0.4500 and even $0.4200 support. It traded towards the $0.4000 level and formed a low at $0.4020. Later, the price started a decent upside recovery and moved above $0.4500. Buyers managed to push the price above the 23.6% Fib retracement level of the last slide from the $0.5208 high to $0.4020 low.
More importantly, yesterday’s highlighted key bearish trend line with resistance at $0.4660 was breached on the hourly chart of the XRP/USD pair. The pair is currently trading near the $0.4800 resistance. Besides, the 61.8% Fib retracement level of the last slide from the $0.5208 high to $0.4020 low is acting as a resistance. Above $0.4800, the main resistance is near the $0.4860 and $0.4900 levels. The 100 hourly simple moving average is also positioned near the $0.4920 level to act as a strong resistance. Therefore, it won’t be easy for buyers to clear the $0.4860, $0.4900 and $0.4920 levels.
Looking at the chart, ripple price may perhaps consolidate in the short term above $0.4700. Finally, there could be an attempt to clear the $0.4900 resistance. On the downside, the key support is at $0.4500 followed by $0.4200.
Looking at the technical indicators:
Hourly MACD – The MACD for XRP/USD is back in the bullish zone.
Hourly RSI (Relative Strength Index) – The RSI for XRP/USD is now above the 50 level.
Major Support Level – $0.4500
Major Resistance Level – $0.4900


