
Reason to trust
How Our News is Made
Strict editorial policy that focuses on accuracy, relevance, and impartiality
Ad discliamer
Morbi pretium leo et nisl aliquam mollis. Quisque arcu lorem, ultricies quis pellentesque nec, ullamcorper eu odio.
Key Highlights
- Ripple price gained traction and traded above the $0.6000 resistance against the US dollar.
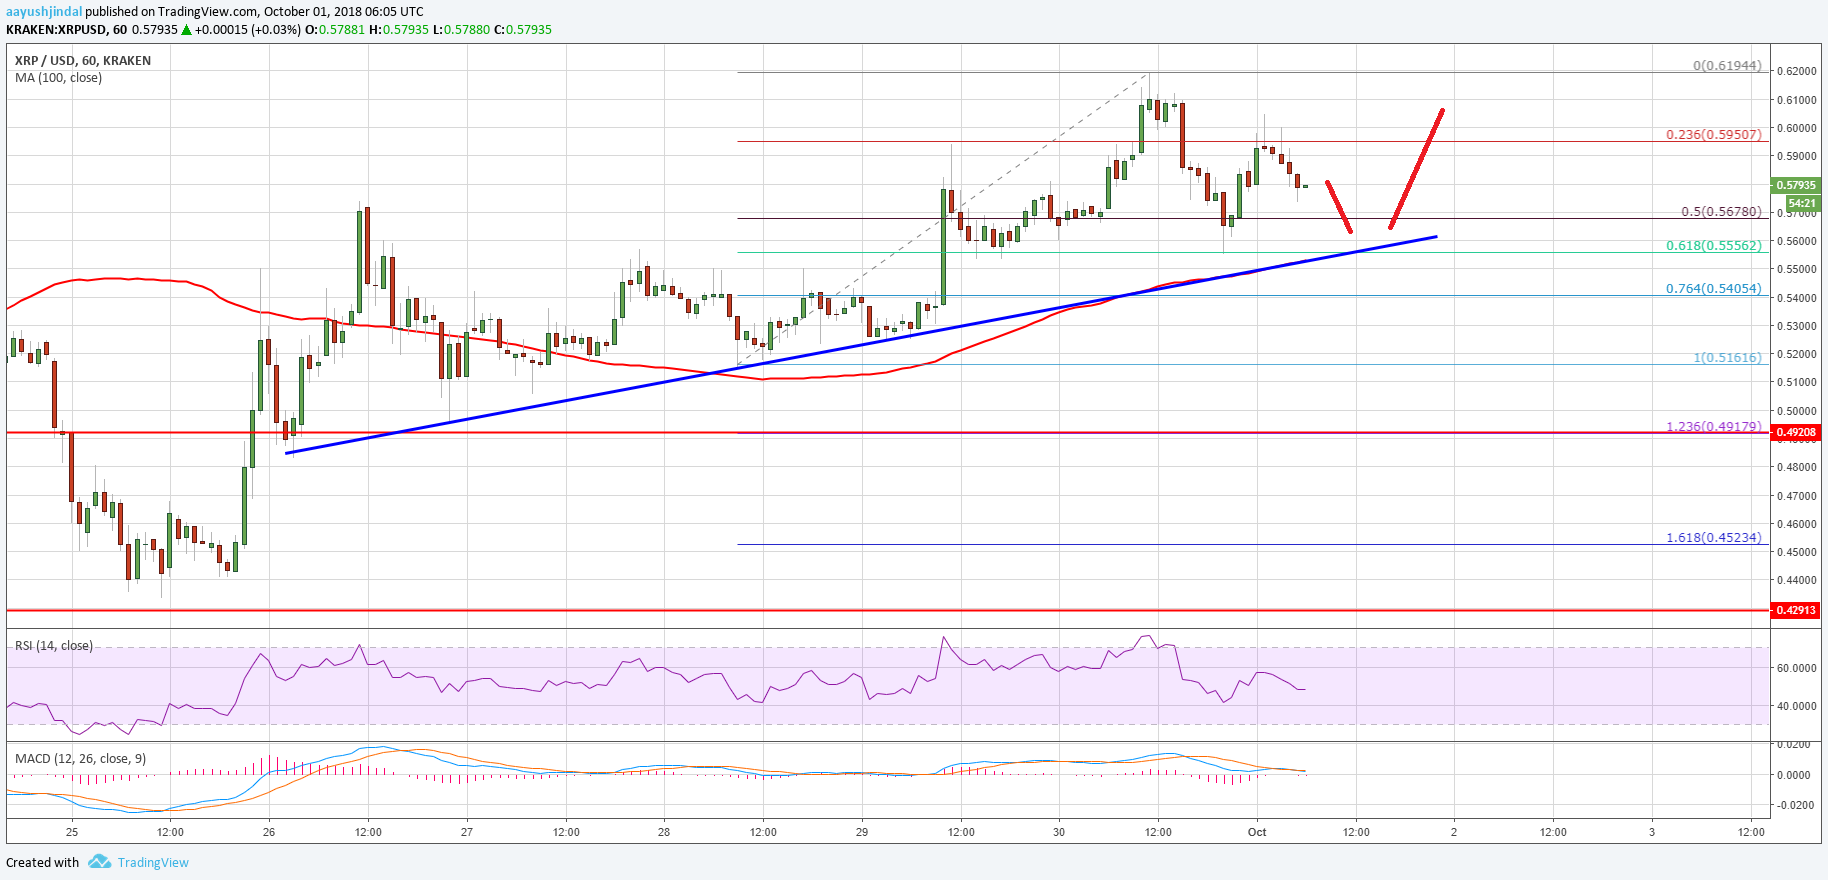
- There is a key bullish trend line in place with support at $0.5555 on the hourly chart of the XRP/USD pair (data source from Kraken).
- The pair could correct lower, but dips towards $0.5500 and $0.5400 remains supported.
Ripple price is trading with a bullish angle against the US Dollar and Bitcoin. XRP/USD is likely to resume upsides above $0.6000 after a short-term downside correction.
Ripple Price Analysis
There were decent gains above the $0.5500 support level in Ripple price against the US Dollar. The XRP/USD pair gained traction and moved above the $0.5800 and $0.6000 resistance levels. A fresh weekly high was formed at $0.6194 and the price settled above the 100 hourly simple moving average. Later, there was a downside correction and the price declined below the $0.5800 support.
There was also a break below the 50% fib retracement level of the last wave from the $0.5161 low to $0.619 high. The price traded towards the $0.5500 support where buyers emerged. The 61.8% fib retracement level of the last wave from the $0.5161 low to $0.619 high was tested. Moreover, there is a key bullish trend line in place with support at $0.5555 on the hourly chart of the XRP/USD pair. The pair is currently trading well above the $0.5550 support with a bullish angle. If there is a break above the $0.5850 and $0.5900 levels, there could be more gains. The next target for buyers could be $0.6000 and $0.6150.
Looking at the chart, ripple price could correct a few points in the short term towards $0.5550. However, buyers are likely to defend any major losses under $0.5450, below which the price may test $0.5200.
Looking at the technical indicators:
Hourly MACD – The MACD for XRP/USD is currently flat in the bearish zone.
Hourly RSI (Relative Strength Index) – The RSI for XRP/USD has moved slightly below the 50 level.
Major Support Level – $0.5500
Major Resistance Level – $0.5900


