
Reason to trust
How Our News is Made
Strict editorial policy that focuses on accuracy, relevance, and impartiality
Ad discliamer
Morbi pretium leo et nisl aliquam mollis. Quisque arcu lorem, ultricies quis pellentesque nec, ullamcorper eu odio.
Key Highlights
- Ripple price is holding gains above the $0.4700 support level against the US dollar.
- There is a key bullish trend line formed with support at $0.4800 on the hourly chart of the XRP/USD pair (data source from Kraken).
- The pair is likely to accelerate gains once there is a break above the $0.5000 and $0.5180 levels.
Ripple price is trading in a bullish zone against the US Dollar and Bitcoin. XRP/USD remains well supported on the downside near the $0.4800 level.
Ripple Price Analysis
Recently, there was a decent support base formed near the $0.4500 level in ripple price against the US Dollar. The XRP/USD pair traded higher and broke the $0.4800 and $0.5000 resistance levels. There was even a close above the $0.4800 level and the 100 hourly simple moving average. Buyers pushed the price above the $0.5100 level, which is a positive sign. A high was formed at $0.5183 and later the price started a downside correction.
It declined below $0.5000 and the 23.6% Fib retracement level of the last wave from the $0.5480 low to $0.5183 high. However, there are many supports on the downside near the $0.4820 and $0.4800 levels. More importantly, there is a key bullish trend line formed with support at $0.4800 on the hourly chart of the XRP/USD pair. The trend line support is close to the 100 hourly SMA at $0.4760. Besides, the 61.8% Fib retracement level of the last wave from the $0.5480 low to $0.5183 high is near $0.4810. Therefore, as long as the price is above the $0.4800 support and the 100 hourly SMA, there could be more gains in the near term.
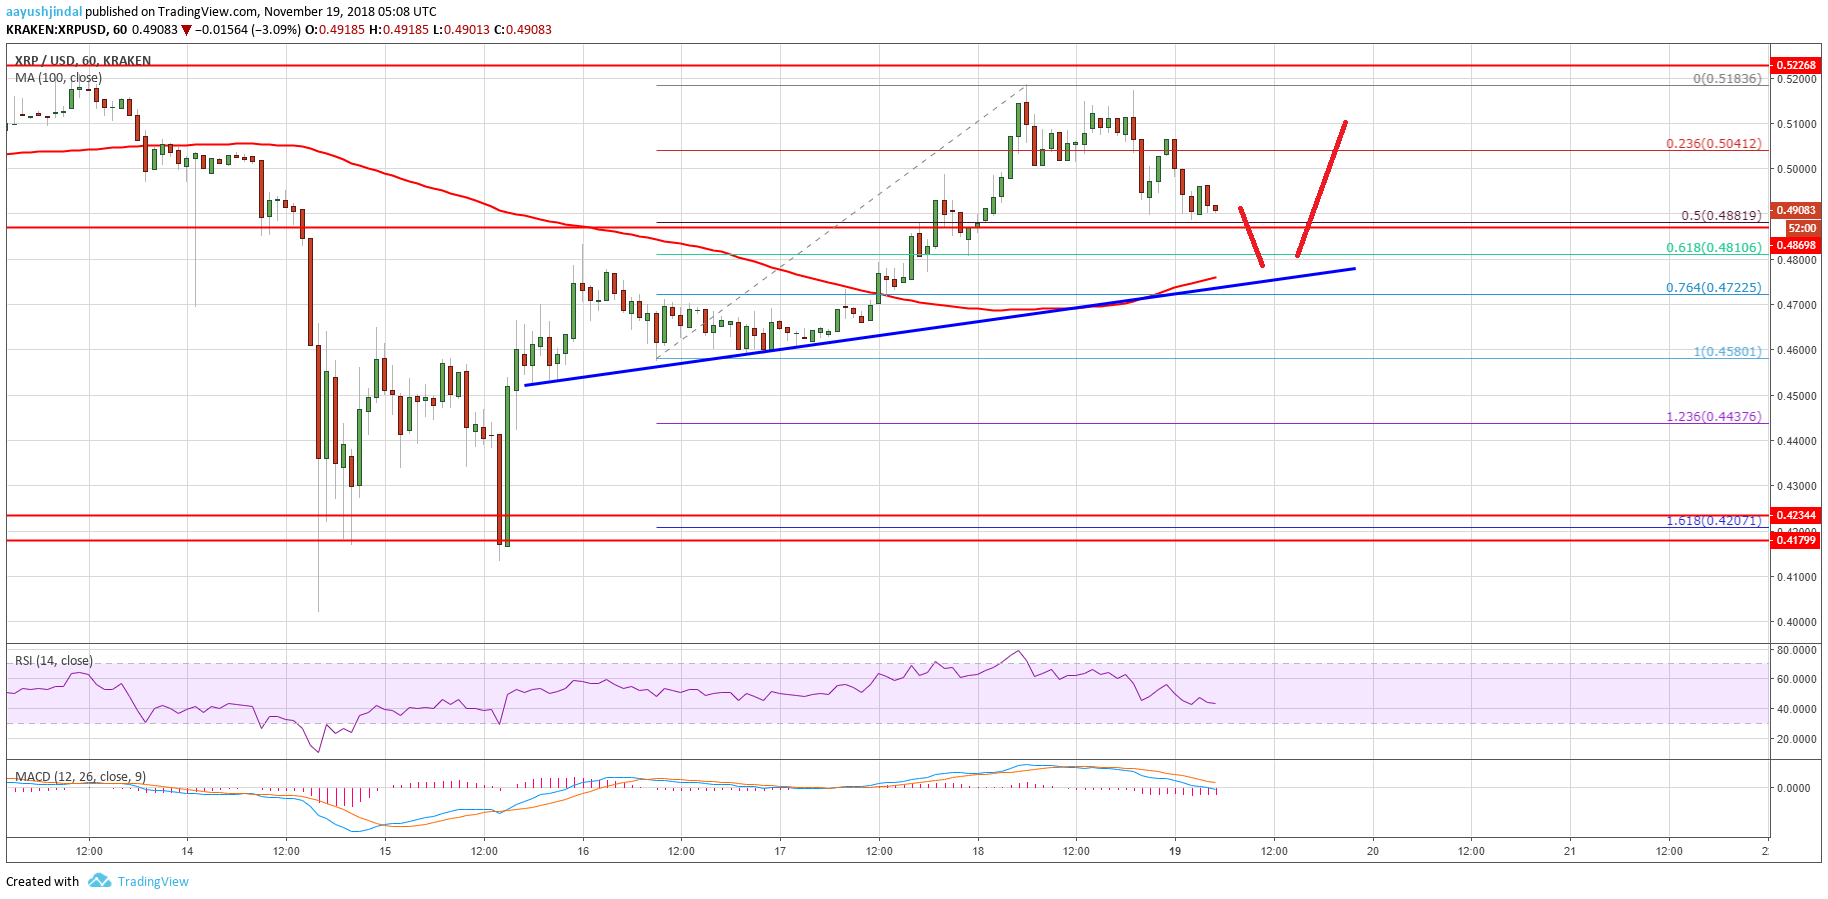
Looking at the chart, ripple price must break the $0.5000 and $0.5120 level to start a fresh bullish wave. The next major resistance is at $0.5250 and $0.5275.
Looking at the technical indicators:
Hourly MACD – The MACD for XRP/USD is slightly in the bearish zone.
Hourly RSI (Relative Strength Index) – The RSI for XRP/USD is just below the 50 level.
Major Support Level – $0.4800
Major Resistance Level – $0.5120


