
Reason to trust
How Our News is Made
Strict editorial policy that focuses on accuracy, relevance, and impartiality
Ad discliamer
Morbi pretium leo et nisl aliquam mollis. Quisque arcu lorem, ultricies quis pellentesque nec, ullamcorper eu odio.
Key Highlights
- Ripple price formed a high near the $0.4000 level and later declined against the US dollar.
- There was a break below a major connecting bullish trend line with support at $0.3610 on the hourly chart of the XRP/USD pair (data source from Kraken).
- The pair is currently under pressure and it could decline towards the $0.3380 or 0.3300 support.
Ripple price started a downside correction against the US Dollar and Bitcoin. XRP/USD may continue to correct lower towards the $0.3300 support in the near term.
Ripple Price Analysis
After forming a high near the $0.4000 level, ripple price started a downside move against the US Dollar. The XRP/USD pair traded below the $0.3800 and $0.3750 support levels to enter a short term bearish zone. Later, the pair even broke the $0.3650 support and the 100 hourly simple moving average. The decline was such that the price broke the 61.8% Fib retracement level of the last wave from the $0.3304 low to $0.40005 high.
More importantly, there was a break below a major connecting bullish trend line with support at $0.3610 on the hourly chart of the XRP/USD pair. The pair is currently trading with a bearish angle below $0.3650 and the 100 hourly SMA. An immediate support is near $0.3460 and the 76.4% Fib retracement level of the last wave from the $0.3304 low to $0.40005 high. Below $0.3460, the price is likely to test the $0.3380 support area. Finally, the main support is near the last swing low at $0.3300.
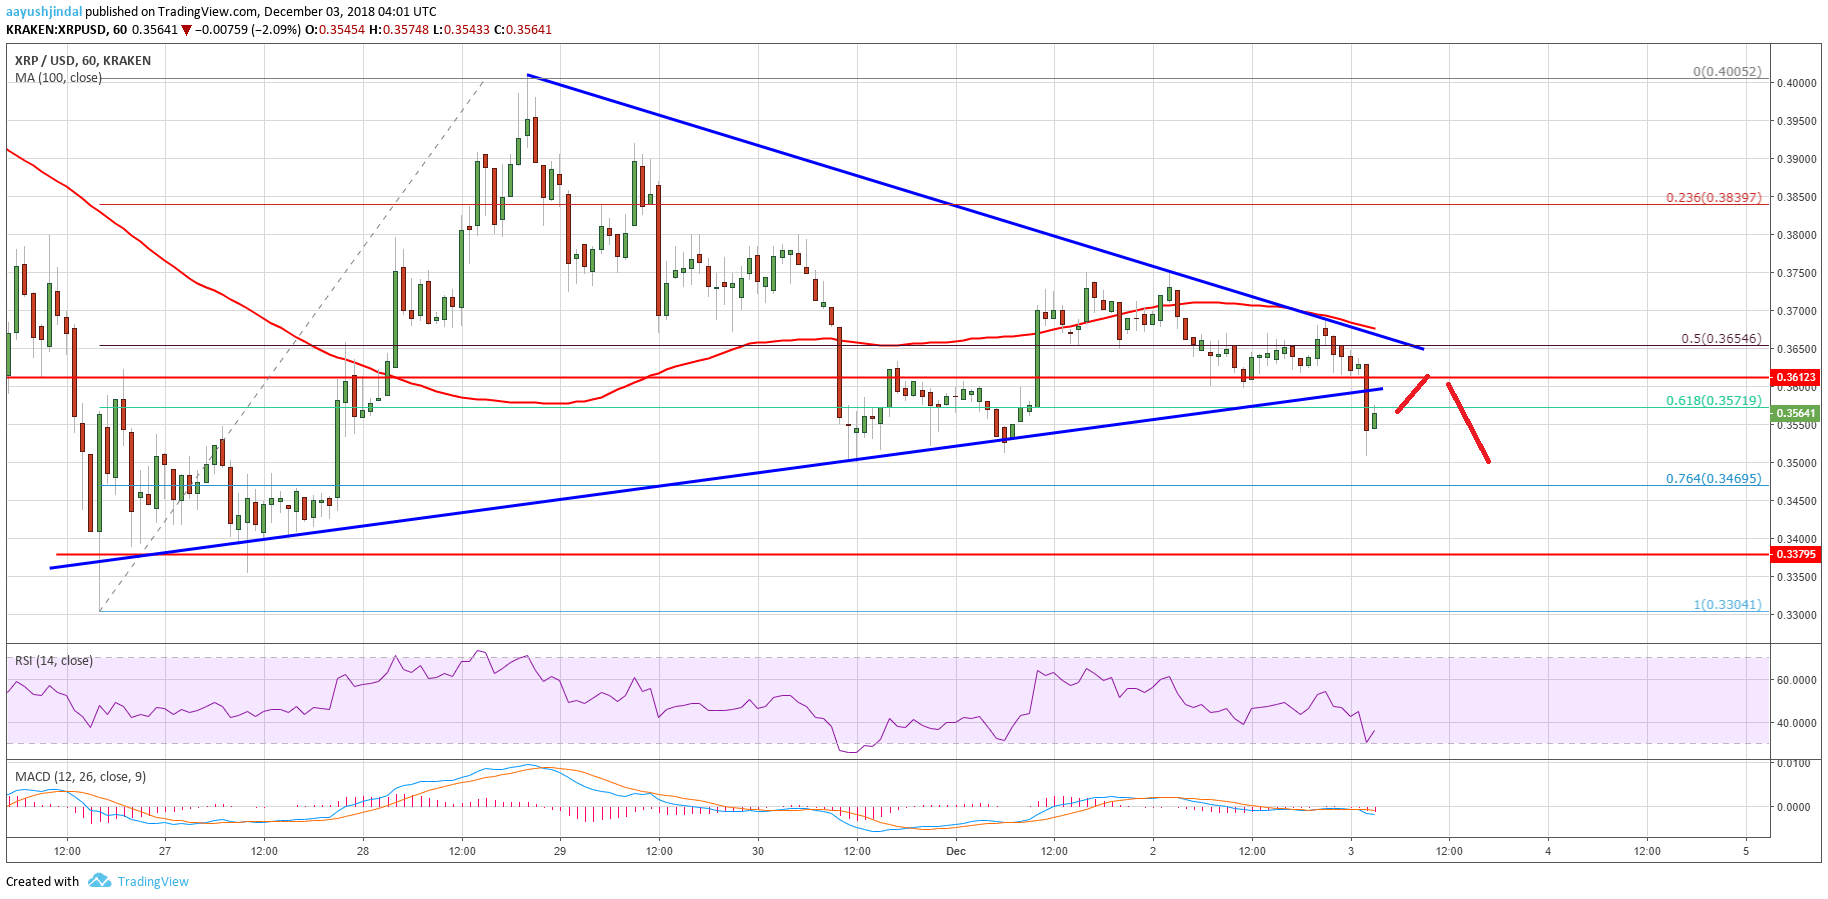
Looking at the chart, ripple price is facing a solid resistance near the $0.3650 level and the 100 hourly SMA. Therefore, to move into a positive zone, a close above $0.3650 and $0.3700 is required.
Looking at the technical indicators:
Hourly MACD – The MACD for XRP/USD is now placed heavily in the bearish zone.
Hourly RSI (Relative Strength Index) – The RSI for XRP/USD is now well below the 40 level.
Major Support Level – $0.3380
Major Resistance Level – $0.3700


