
Reason to trust
How Our News is Made
Strict editorial policy that focuses on accuracy, relevance, and impartiality
Ad discliamer
Morbi pretium leo et nisl aliquam mollis. Quisque arcu lorem, ultricies quis pellentesque nec, ullamcorper eu odio.
Key Highlights
- Ripple price declined further and traded towards the $0.3600 support zone against the US dollar.
- There is a monster bearish trend line in place with resistance near $0.4290 on the hourly chart of the XRP/USD pair (data source from Kraken).
- The pair could correct higher towards $0.4200 and $0.4290 in the short term before resuming its slide.
Ripple price is slowly recovering against the US Dollar and Bitcoin. XRP/USD is likely to correct to $0.4290 before sellers take back control from buyers.
Ripple Price Analysis
Yesterday, we saw a sharp downside move below the $0.4000 level in Ripple price against the US Dollar. The XRP/USD pair spiked towards $0.3900 before correcting higher. However, the correction was limited and the price declined further below $0.3900 and $0.3800. It traded close to the $0.3580 level and formed a low at $0.3589. The price is currently correcting higher, but it is still well below $0.4400 and the 100 hourly simple moving average.
It has moved above the 23.6% Fib retracement level of the last slide from the $0.4990 swing high to $0.3589 low. It seems like it is about to break a short term bearish trend line at $0.4000 on the hourly chart. In the mentioned case, the price may continue to correct higher towards the $0.4200 and $0.7290 levels. The next major hurdle is near $0.4290 and the 50% Fib retracement level of the last slide from the $0.4990 swing high to $0.3589 low. Moreover, there is a monster bearish trend line in place with resistance near $0.4290 on the same chart of the XRP/USD pair.
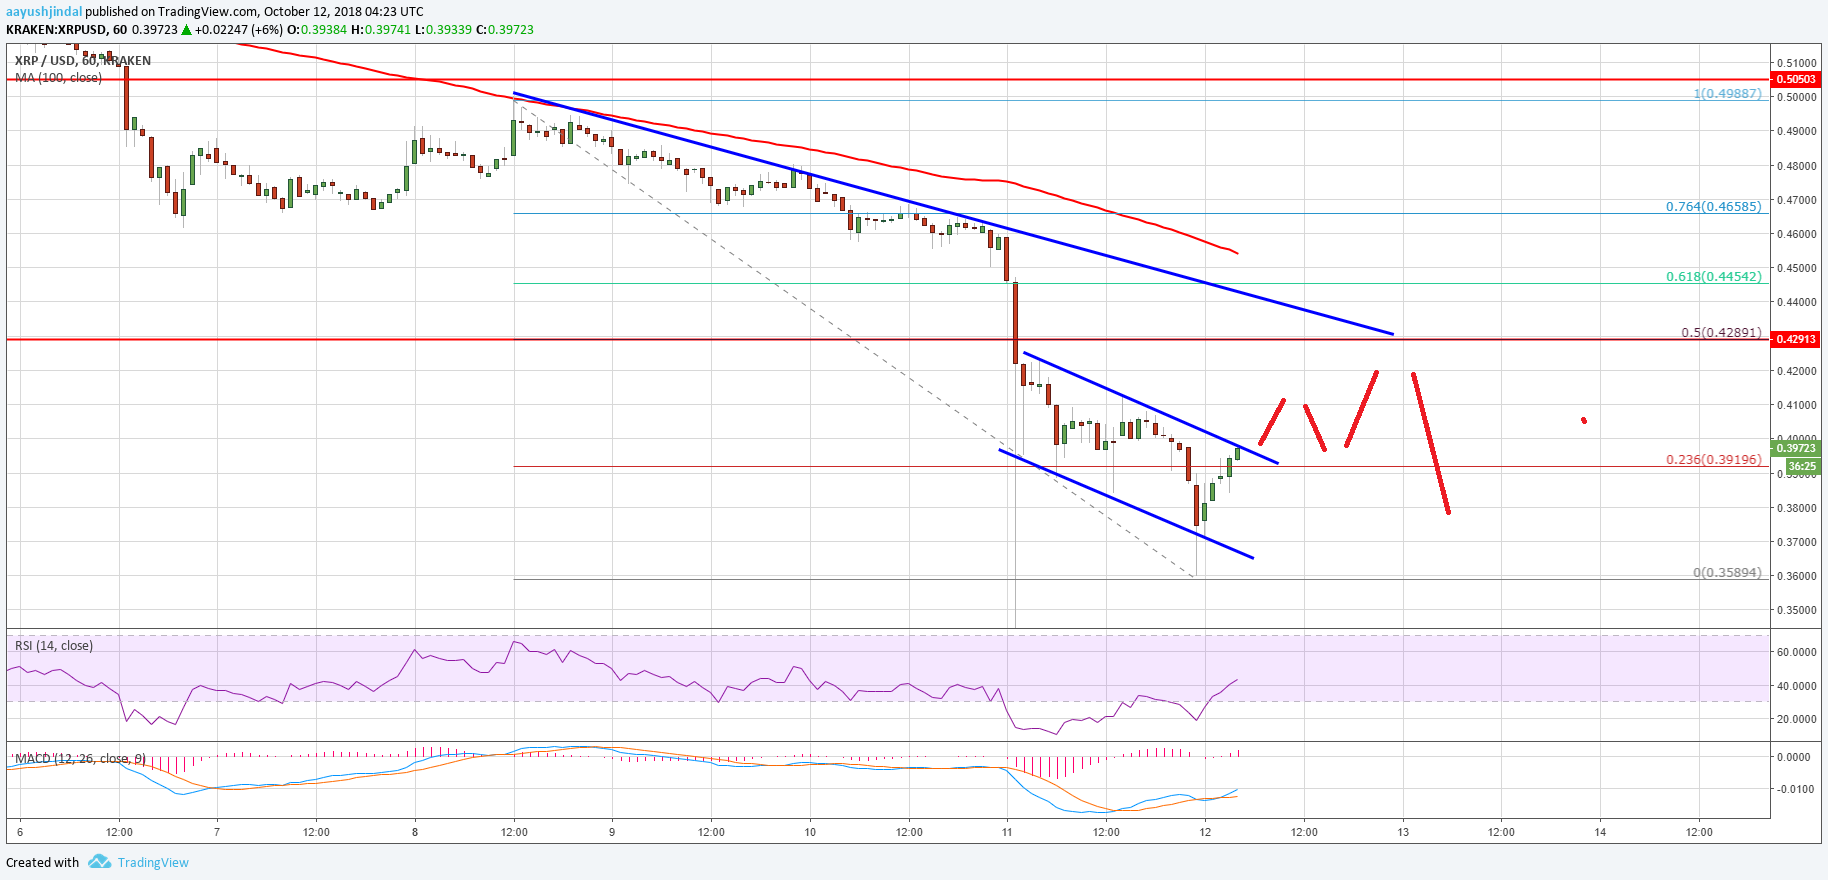
Looking at the chart, ripple price could correct towards the $0.4290 zone, but later it is likely to resume its slide below $0.4000 in the near term.
Looking at the technical indicators:
Hourly MACD – The MACD for XRP/USD is slowly moving in the bullish zone.
Hourly RSI (Relative Strength Index) – The RSI for XRP/USD is moving higher towards 50 level.
Major Support Level – $0.3800
Major Resistance Level – $0.4290


