
Reason to trust
How Our News is Made
Strict editorial policy that focuses on accuracy, relevance, and impartiality
Ad discliamer
Morbi pretium leo et nisl aliquam mollis. Quisque arcu lorem, ultricies quis pellentesque nec, ullamcorper eu odio.
Key Highlights
- Ripple price found a strong support near the $0.4320 level and bounced back against the US dollar.
- Yesterday’s highlighted key bearish trend line was broken with resistance at $0.4505 on the hourly chart of the XRP/USD pair (data source from Kraken).
- The pair gained momentum above $0.4550 and traded towards the $0.4700 resistance.
Ripple price climbed higher nicely against the US Dollar and Bitcoin. XRP/USD may continue to move higher towards the $0.4750 and $0.4800 levels in the near term.
Ripple Price Analysis
Yesterday, we discussed that a break above $0.4550 could trigger gains in ripple price against the US Dollar. The XRP/USD pair dipped a few points recently, but it found a strong support near the $0.4320 level. As a result, the price bounced back sharply and broke the $0.4400 and $0.4550 resistance levels. There was also a break above the 61.8% Fib retracement level of the last slide from the $0.4613 high to $0.4322 low.
Additionally, there was a close above the $0.4500 level and the 100 hourly simple moving average. More importantly, yesterday’s highlighted key bearish trend line was broken with resistance at $0.4505 on the hourly chart of the XRP/USD pair. The pair traded above the $0.4613 high as well. It traded close to the 1.236 Fib extension level of the last slide from the $0.4613 high to $0.4322 low. The price found resistance near $0.4700 and it is currently consolidating above the $0.4600 level. On the downside, the previous resistances near the $0.4550 and $0.4540 levels are likely to act as supports.
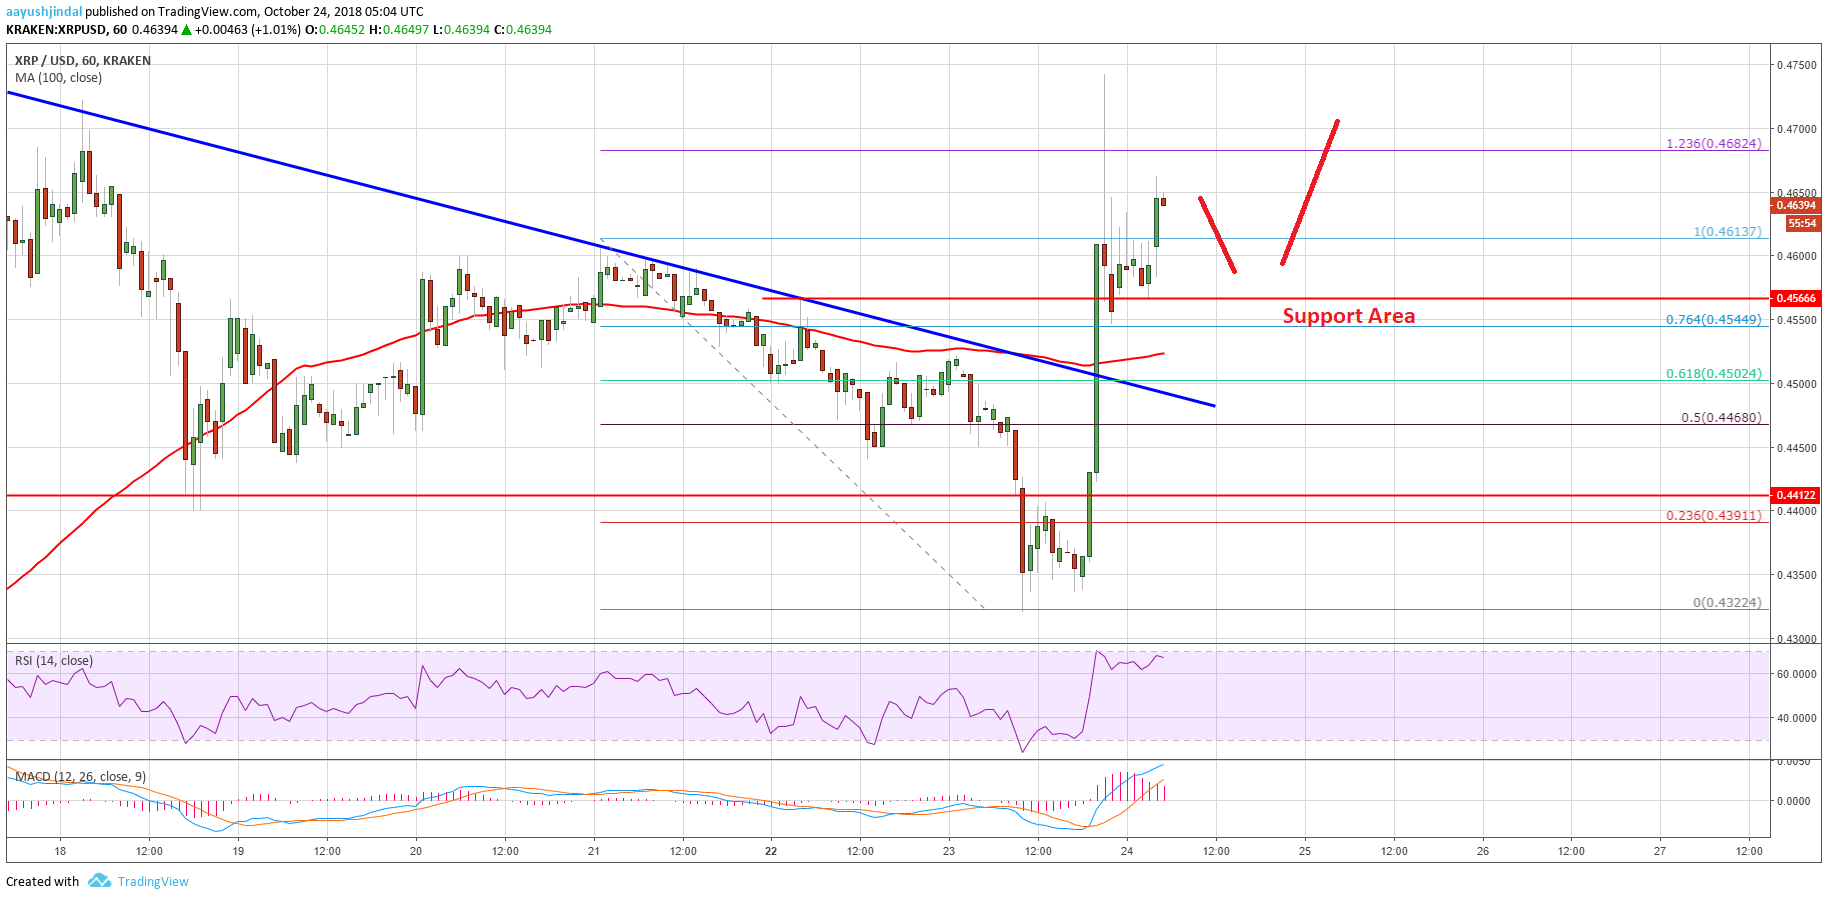
Looking at the chart, ripple price is back in a positive zone above the $0.4500 level. It seems like the price may continue to move higher towards $0.4750 and $0.4800 levels in the near term.
Looking at the technical indicators:
Hourly MACD – The MACD for XRP/USD is gaining strength in the bullish zone.
Hourly RSI (Relative Strength Index) – The RSI for XRP/USD is well above the 55 level.
Major Support Level – $0.4500
Major Resistance Level – $0.4750


