
Reason to trust
How Our News is Made
Strict editorial policy that focuses on accuracy, relevance, and impartiality
Ad discliamer
Morbi pretium leo et nisl aliquam mollis. Quisque arcu lorem, ultricies quis pellentesque nec, ullamcorper eu odio.
Key Highlights
- Ripple price traded further higher and broke the $.0.4600 resistance area against the US dollar.
- There was a break above a declining channel with resistance at $0.4535 on the hourly chart of the XRP/USD pair (data source from Kraken).
- The pair traded as high as $0.4755 and it is currently correcting lower.
Ripple price is gaining bullish momentum against the US Dollar and Bitcoin. XRP/USD remains well supported on dips near the $0.4540 level.
Ripple Price Analysis
Recently, there was a decent support base formed near the $0.4470 level in ripple price against the US Dollar. The XRP/USD pair started an upside move and broke the $0.4500 resistance. The price moved into a bullish zone and settled above the $0.4540 resistance. There was even a close above the $0.4550 level and the 100 hourly simple moving average.
More importantly, there was a break above a declining channel with resistance at $0.4535 on the hourly chart of the XRP/USD pair. Buyers gained momentum, resulting in a solid run above the $0.4600 resistance. The price even spiked above the $0.4750 level and traded as high as $0.4755. Later, there was a downside correction and the price traded below the $0.4650 level. There was a break below the 50% Fib retracement level of the recent wave from the $0.4469 low to $0.4755 high. However, there are many decent supports on the downside near the $0.4540 level and the 100 hourly simple moving average.
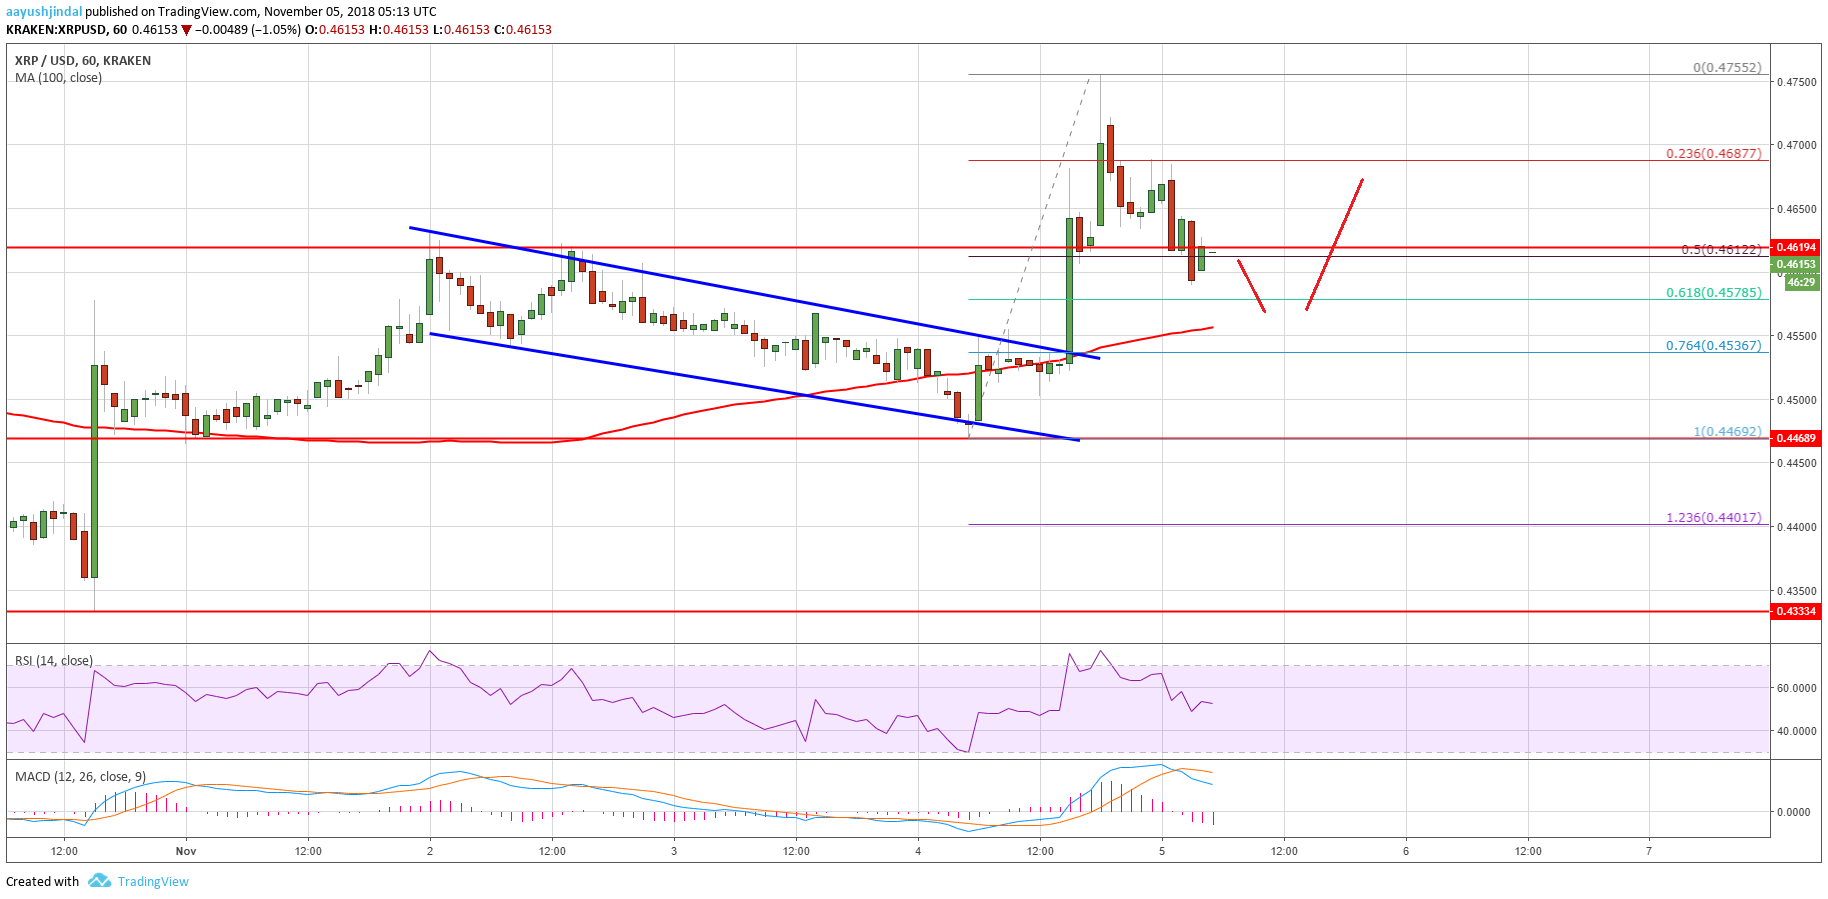
Looking at the chart, ripple price could test the $0.4540-50 support zone. Moreover, the 61.8% Fib retracement level of the recent wave from the $0.4469 low to $0.4755 high is an immediate support at $0.4578. Therefore, if the price dips from the current levels, it may find support near $0.4560 or $0.4550.
Looking at the technical indicators:
Hourly MACD – The MACD for XRP/USD is back in the bearish zone.
Hourly RSI (Relative Strength Index) – The RSI for XRP/USD is currently above the 50 level.
Major Support Level – $0.4550
Major Resistance Level – $0.4700


