
Reason to trust
How Our News is Made
Strict editorial policy that focuses on accuracy, relevance, and impartiality
Ad discliamer
Morbi pretium leo et nisl aliquam mollis. Quisque arcu lorem, ultricies quis pellentesque nec, ullamcorper eu odio.
Key Highlights
- Ripple price declined and revisited the $0.3380 support area against the US dollar.
- Yesterday’s highlighted important bearish trend line is in place with resistance at $0.3500 on the hourly chart of the XRP/USD pair (data source from Kraken).
- The pair must stay above the $0.3380 and $0.3360 support levels to bounce back in the near term.
Ripple price is under pressure against the US Dollar and Bitcoin. XRP/USD needs to surpass $0.3500 and $0.3540 to gain bullish momentum.
Ripple Price Analysis
During the past few sessions, there were bearish moves below $0.3650 in ripple price against the US Dollar. The XRP/USD pair traded lower below $0.3500 and settled below the 100 hourly simple moving average. There were a couple of correction waves, but upsides were capped by $0.3650 and $0.3510. The last rejection was near the $0.3500-0.3510 zone before the price traded below $0.3400.
The price tested the $0.3360-0.3380 support area where buyers emerged. A fresh low was formed at $0.3341 and the price is currently consolidating. The first hurdle is yesterday’s highlighted important bearish trend line is in place with resistance at $0.3500 on the hourly chart of the XRP/USD pair. Above the trend line, the 50% Fib retracement level of the last drop from the $0.3750 high to $0.3341 low may stop upsides. However, the main resistance is near $0.3580 and the 100 hourly SMA. It coincides with the 61.8% Fib retracement level of the last drop from the $0.3750 high to $0.3341 low.
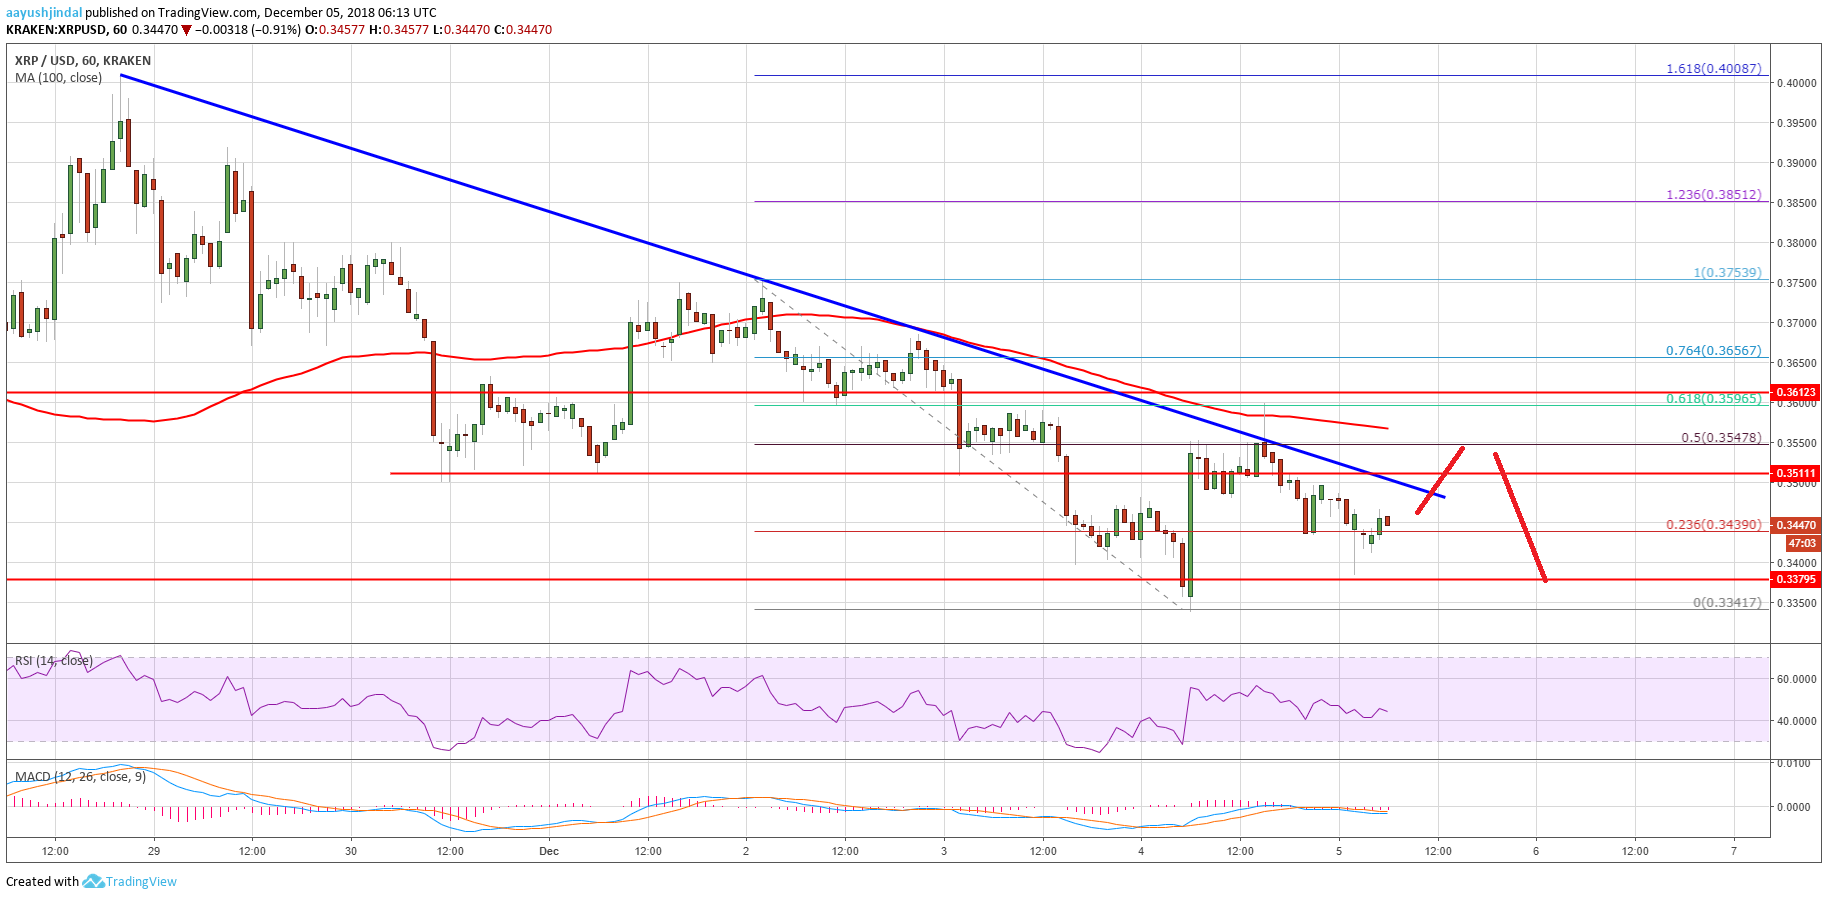
Looking at the chart, ripple price seems to be following a bearish path below $0.3600 and $0.3580. On the downside, if there is a break below the $0.3380 and $0.3360 supports, there could be more losses. The next key support is near $0.3180 where buyers could emerge.
Looking at the technical indicators:
Hourly MACD – The MACD for XRP/USD is about to move into the bullish zone.
Hourly RSI (Relative Strength Index) – The RSI for XRP/USD is just above the 40 level.
Major Support Level – $0.3380
Major Resistance Level – $0.3580


