
Reason to trust
How Our News is Made
Strict editorial policy that focuses on accuracy, relevance, and impartiality
Ad discliamer
Morbi pretium leo et nisl aliquam mollis. Quisque arcu lorem, ultricies quis pellentesque nec, ullamcorper eu odio.
Key Highlights
- Ripple price failed to recover above the $0.3600 resistance level and declined against the US dollar.
- There is a major bearish trend line formed with resistance at $0.3550 on the hourly chart of the XRP/USD pair (data source from Kraken).
- The pair is currently at a risk of a downside break below the $0.3400 and $0.3300 support levels.
Ripple price remains in a bearish zone against the US Dollar and Bitcoin. XRP/USD could accelerate declines if sellers push the price below $0.3400.
Ripple Price Analysis
Yesterday, we discussed a possible downward move towards $0.3000 in ripple price against the US Dollar. The XRP/USD pair did trade lower and broke the $0.3500 support level. The price tested the $0.3400 level and it is currently consolidating losses. The current price action is bearish below $0.3600 and the 100 hourly simple moving average. An initial resistance is near the 23.6% Fib retracement level of the recent slide from the $0.3753 high to $0.3400 low.
On the upside, there are many hurdles for buyers near the $0.3550 and $0.3600 levels. There is also a major bearish trend line formed with resistance at $0.3550 on the hourly chart of the XRP/USD pair. The trend line is near the 50% Fib retracement level of the recent slide from the $0.3753 high to $0.3400 low. Above the trend line, the next hurdle is near the $0.3600 level and the 100 hourly SMA. Therefore, if the price corrects higher, it could find a strong resistance near $0.3500 or $0.3600.
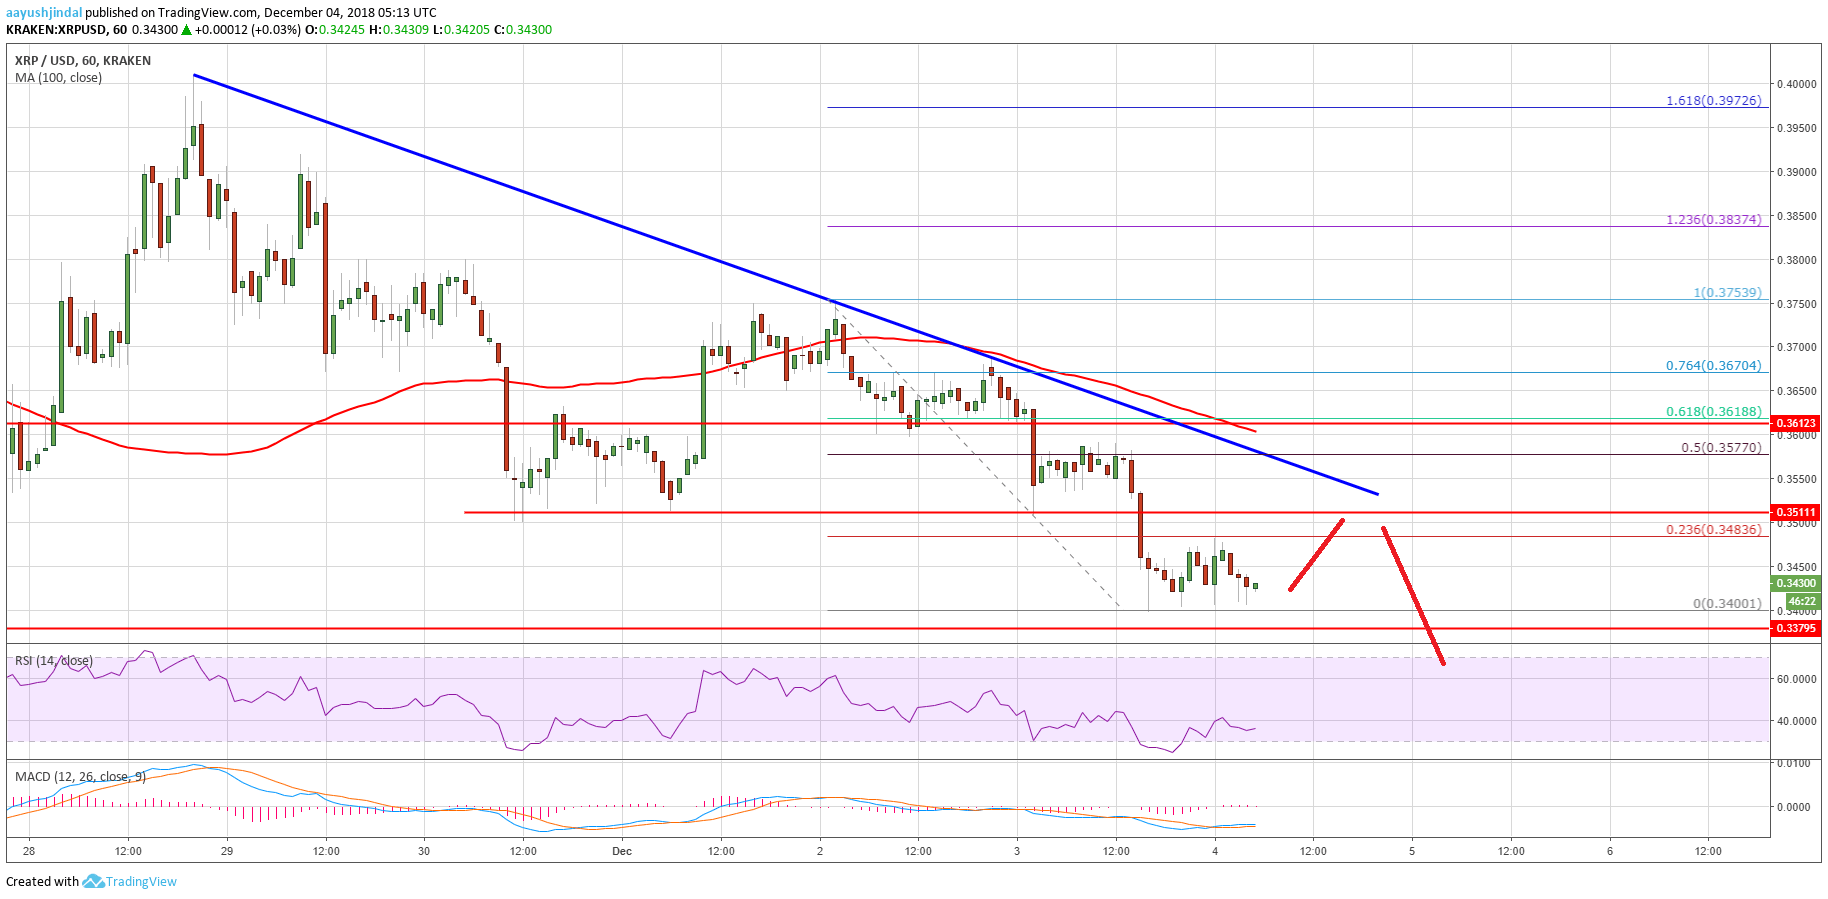
Looking at the chart, ripple price is struggling to recover above $0.3600. If sellers remain in action, the price could break the $0.3400 low. The next key support is at $0.3300, below which the price may test $0.3180.
Looking at the technical indicators:
Hourly MACD – The MACD for XRP/USD is currently flat in the bearish zone.
Hourly RSI (Relative Strength Index) – The RSI for XRP/USD is now around the 35 level.
Major Support Level – $0.3400
Major Resistance Level – $0.3600


