
Reason to trust
How Our News is Made
Strict editorial policy that focuses on accuracy, relevance, and impartiality
Ad discliamer
Morbi pretium leo et nisl aliquam mollis. Quisque arcu lorem, ultricies quis pellentesque nec, ullamcorper eu odio.
Key Highlights
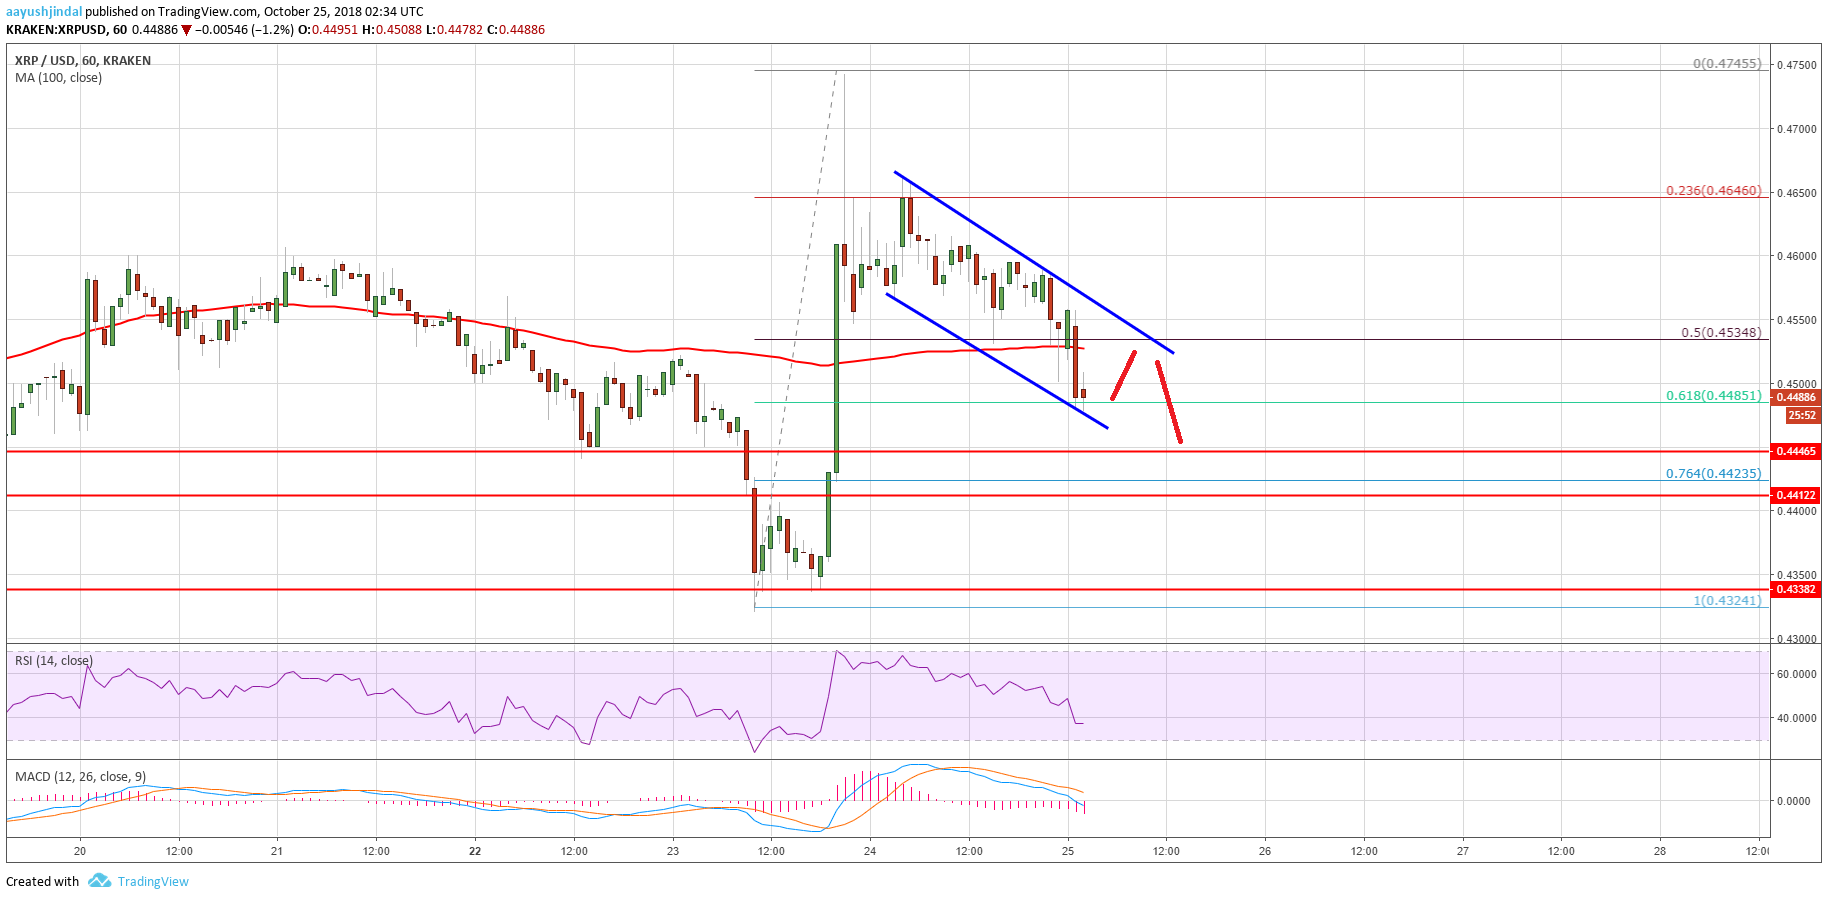
- Ripple price started a downside correction after trading towards the $0.4740 level against the US dollar.
- There is a short term declining channel in place with resistance at $0.4540 on the hourly chart of the XRP/USD pair (data source from Kraken).
- The pair is likely to find a decent support near the $0.4460 and $0.4425 levels in the near term.
Ripple price is correcting lower against the US Dollar and Bitcoin. XRP/USD may soon test the key supports above the $0.4400 level.
Ripple Price Analysis
Yesterday, we saw a solid upward move in ripple price above the $0.4600 level against the US Dollar. The XRP/USD pair traded above the $0.4650 and $0.4700 levels. It traded as high as $0.4745 and later started a downside correction. The price moved down and broke the $0.4700 and $0.4600 support levels. Moreover, there was a break below the 50% Fib retracement level of the last wave from the $0.4324 low to $0.4745 high.
It is currently trading well below the $0.4600 level and the 100 hourly simple moving average. More importantly, there is a short term declining channel in place with resistance at $0.4540 on the hourly chart of the XRP/USD pair. An immediate support is the 61.8% Fib retracement level of the last wave from the $0.4324 low to $0.4745 high at $0.4480. Below this, the price could test the next key supports near the $0.4460 and $0.4425 levels in the near term. On the upside, a break above the $0.4540 and $0.4600 resistances may open the doors for a fresh upside.
Looking at the chart, ripple price is approaching a few important supports above $0.4400. As long as the price is above $0.4400, it could bounce back in the near term.
Looking at the technical indicators:
Hourly MACD – The MACD for XRP/USD has moved back in the bearish zone.
Hourly RSI (Relative Strength Index) – The RSI for XRP/USD is well above the 50 level.
Major Support Level – $0.4400
Major Resistance Level – $0.4540


