
Reason to trust
How Our News is Made
Strict editorial policy that focuses on accuracy, relevance, and impartiality
Ad discliamer
Morbi pretium leo et nisl aliquam mollis. Quisque arcu lorem, ultricies quis pellentesque nec, ullamcorper eu odio.
- Ripple price rallied recently and broke many key resistances near $0.3080 against the US dollar.
- The price even settled above the $0.3100 resistance and the 100 hourly simple moving average.
- Yesterday’s highlighted key bearish trend line was breached with resistance at $0.3085 on the hourly chart of the XRP/USD pair (data source from Kraken).
- The pair rallied towards the $0.3250 resistance level and later corrected lower sharply.
Ripple price moved nicely into a bullish zone against the US Dollar and bitcoin. XRP/USD is trading above the $0.3100 support and it could resume its upward move in the near term.
Ripple Price Analysis
Recently, we saw a steady decline in ripple price from the $0.3150 swing high against the US Dollar. The XRP/USD pair traded below the $0.3100 and $0.3080 support levels. However, the $0.3040 support area acted as a strong support. The price started a solid upward move and broke the $0.3060 and $0.3080 resistance levels to move into a positive zone. There was a break above the 61.8% Fib retracement level of the last decline from the $0.3135 high to $0.3045 low.
More importantly, yesterday’s highlighted key bearish trend line was breached with resistance at $0.3085 on the hourly chart of the XRP/USD pair. It opened the doors for more gains and the price rallied above the $0.3100 resistance and the 100 hourly simple moving average. The upward move was strong as the price climbed above the $0.3150 and $0.3200 resistance levels. It traded towards the $0.3250 resistance level and later corrected lower sharply. It declined below the $0.3200 level and the 50% Fib retracement level of the recent rally from the $0.3060 low to $0.3245 high.
However, the previous key resistance near the $0.3100 level is acting as a strong support. Besides, the 76.4% Fib retracement level of the recent rally from the $0.3060 low to $0.3245 high is also near $0.3100. Furthermore, the 100 hourly SMA is also near the $0.3100 level. Therefore, as long as the price is above $0.3100, it could bounce back in the near term.
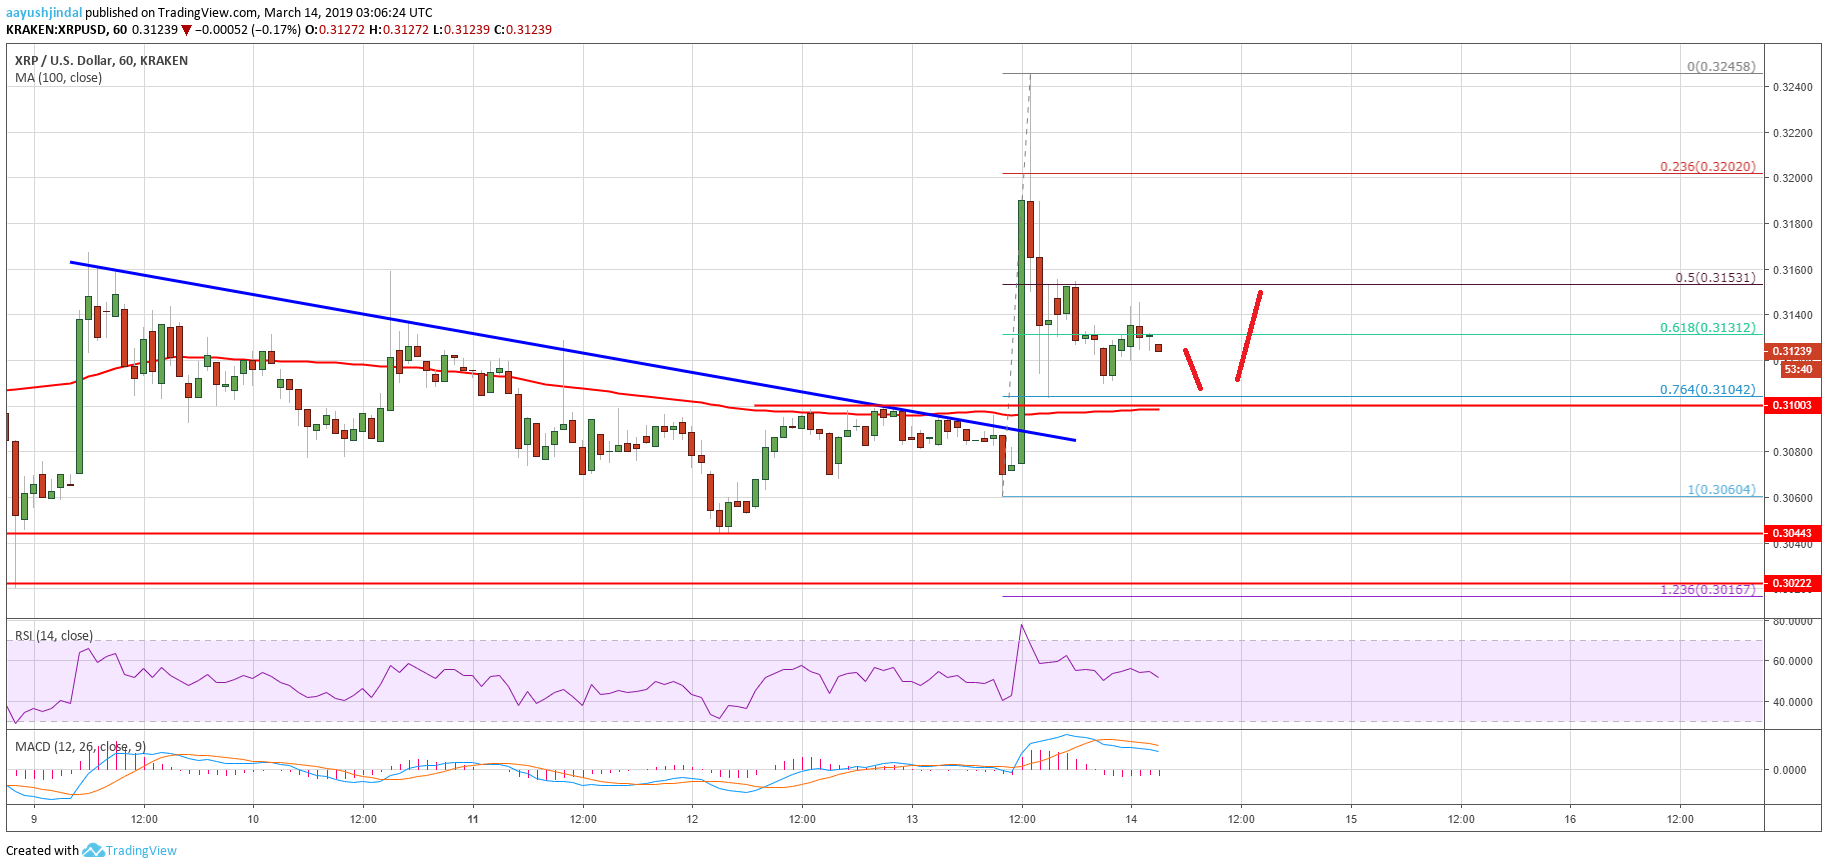
Looking at the chart, ripple price clearly jumped into a positive zone above $0.3100. Having said that, it was rejected above the $0.3200 level. In the short term, there could be a few bearish moves, but the price is likely to climb above $0.3150 and $0.3180. A close above $0.3200 is needed for an upside acceleration.
Technical Indicators
Hourly MACD – The MACD for XRP/USD is likely to move back into the bullish zone.
Hourly RSI (Relative Strength Index) – The RSI for XRP/USD corrected lower recently, but it is still above the 50 level.
Major Support Levels – $0.3100, $0.3080 and $0.3065.
Major Resistance Levels – $0.3150, $0.3180 and $0.3200.


