
Reason to trust
How Our News is Made
Strict editorial policy that focuses on accuracy, relevance, and impartiality
Ad discliamer
Morbi pretium leo et nisl aliquam mollis. Quisque arcu lorem, ultricies quis pellentesque nec, ullamcorper eu odio.
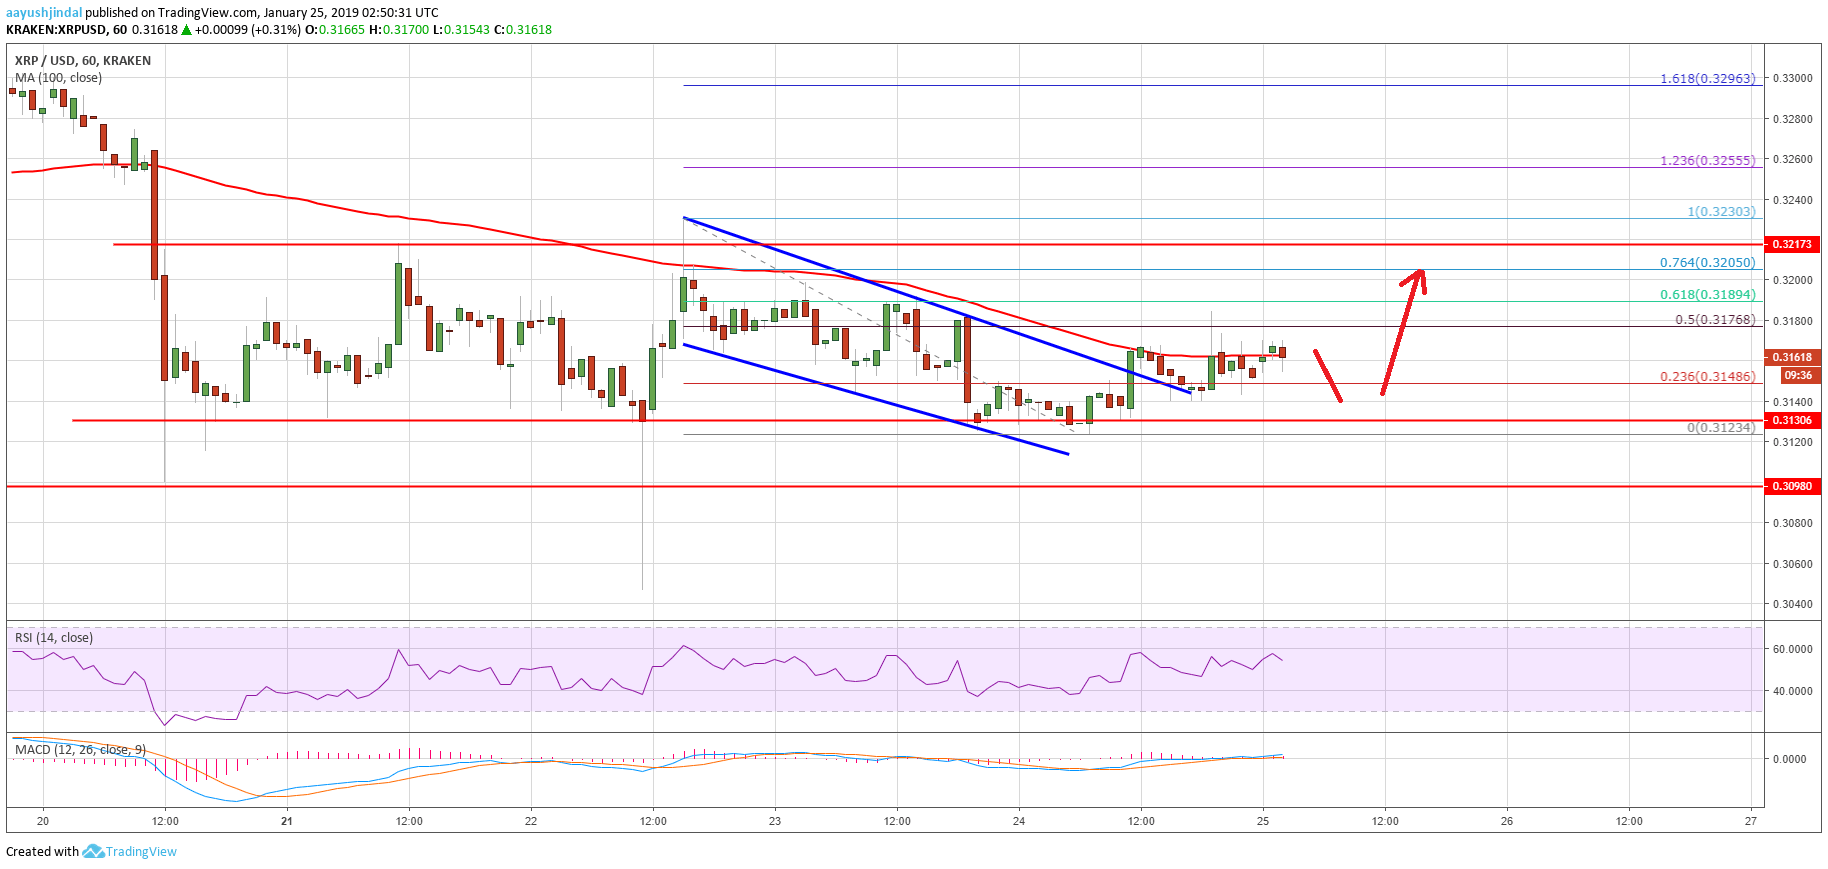
- Ripple price corrected lower and tested the $0.3130 support area against the US dollar.
- There was a break above a key declining channel with resistance at $0.3145 on the hourly chart of the XRP/USD pair (data source from Kraken).
- The pair is currently trading in a range below the key resistance levels at $0.3200 and $0.3220.
Ripple price remains supported on dips against the US Dollar and Bitcoin. However, XRP/USD must break the $0.3200 and $0.3220 resistance levels to gain bullish momentum.
Ripple Price Analysis
Yesterday, we saw yet another rejection near the $0.3220 resistance in ripple price against the US Dollar. The XRP/USD pair traded as high as $0.3230 and later started a downside correction. It moved below the $0.3200 level and the 100 hourly simple moving average. However, the decline was protected by the $0.3130 and $0.3120 support levels. Besides, the 61.8% Fib retracement level of the last leg from the $0.3046 low to $0.3230 high acted as a support. The price started a fresh upward move and traded above the $0.3140 level.
Buyers pushed the price above a key declining channel with resistance at $0.3145 on the hourly chart of the XRP/USD pair. Besides, there was a break above the 23.6% Fib retracement level of the recent decline from the $0.3230 high to $0.3123 low. The current price action is slightly bearish since ripple is facing hurdles near the $0.3175 level and the 100 hourly SMA. Additionally, the 50% Fib retracement level of the recent decline from the $0.3230 high to $0.3123 low is acting as a resistance. If there is an upside break above $0.3175, the price could test $0.3200 and $0.3220.
Looking at the chart, ripple price seems to be trading in a tight range above the $0.3120 support level. If it fails to move past $0.3200, there is a risk of a downside break below the $0.3110 and $0.3080 levels in the near term.
Technical Indicators
Hourly MACD – The MACD for XRP/USD is currently flat in the bearish zone, with no positive signs.
Hourly RSI (Relative Strength Index) – The RSI for XRP/USD is placed nicely above the 50 level.
Major Support Level – $0.3120
Major Resistance Level – $0.3220


