
Reason to trust
How Our News is Made
Strict editorial policy that focuses on accuracy, relevance, and impartiality
Ad discliamer
Morbi pretium leo et nisl aliquam mollis. Quisque arcu lorem, ultricies quis pellentesque nec, ullamcorper eu odio.
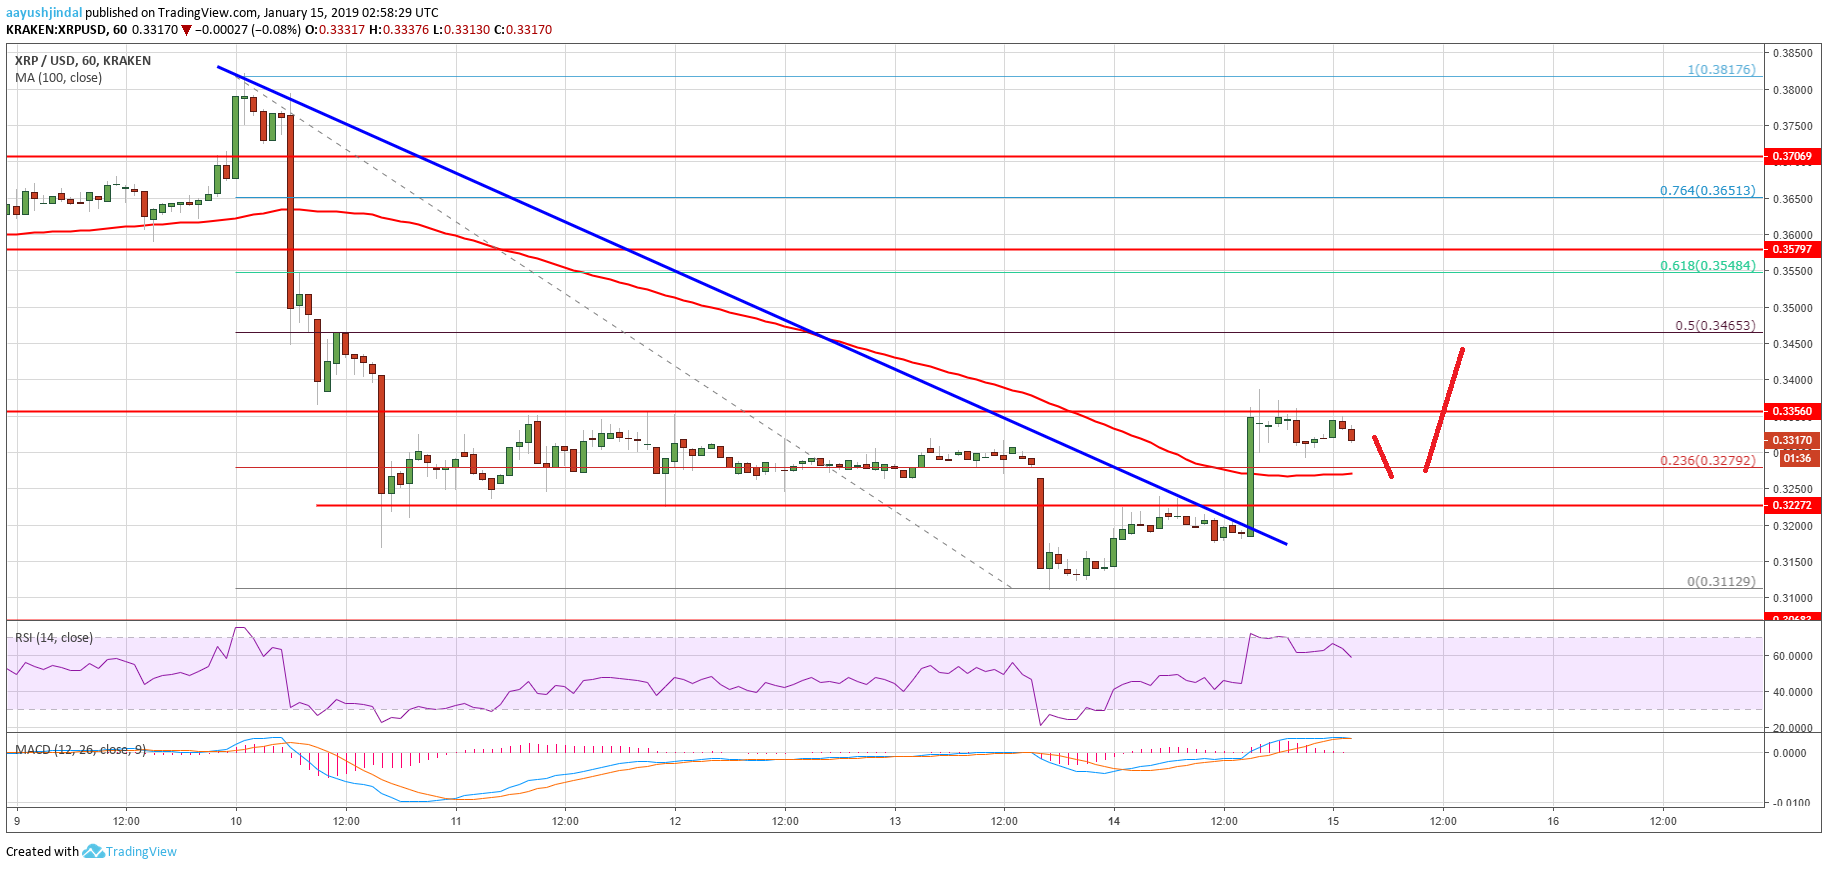
- Ripple price found support above the $0.3100 level and recovered above $0.3300 against the US dollar.
- There was a break above a major bearish trend line with resistance at $0.3200 on the hourly chart of the XRP/USD pair (data source from Kraken).
- The pair could extend gains towards $0.3500 if there is a break above the $0.3360 resistance.
Ripple price recovered nicely in the past few hours against the US Dollar and Bitcoin. XRP/USD may target the $0.3500 resistance if it breaks $0.3360 and $0.3400.
Ripple Price Analysis
Recently, we saw a major drop below the $0.3400 support in ripple price against the US Dollar. The XRP/USD pair even broke the $0.3360 and $0.3200 support levels. It traded close to the $0.3100 level and formed a low at $0.3112. Later, the price started consolidating losses with a bullish angle above $0.3200. Finally, sellers lost control, resulting in a sharp upward move above $0.3250. There was a break above the 23.6% Fib retracement level of the last major drop from the $0.3817 high to $0.3112 low.
More importantly, there was a break above a major bearish trend line with resistance at $0.3200 on the hourly chart of the XRP/USD pair. The pair settled above the $0.3280 level and the 100 hourly simple moving average. However, the price ran into a key resistance near $0.3360 (the previous support and range high). The price is currently consolidating above $0.3280 and the 100 hourly SMA. Buyers need to gain strength above $0.3360 and $0.3375 to push the price further higher. The next stop for them could be near $0.3460. It coincides with the 50% Fib retracement level of the last major drop from the $0.3817 high to $0.3112 low.
Looking at the chart, ripple price made a nice upward move above the $0.3250 and $0.3280 levels. Having said that, a successful close above $0.3360 is needed for an acceleration to $0.3400 and $0.3500.
Technical Indicators
Hourly MACD – The MACD for XRP/USD could move back in the bearish zone, signaling a downside correction.
Hourly RSI (Relative Strength Index) – The RSI for XRP/USD is moving lower towards the 55 level.
Major Support Level – $0.3250
Major Resistance Level – $0.3360


