
Reason to trust
How Our News is Made
Strict editorial policy that focuses on accuracy, relevance, and impartiality
Ad discliamer
Morbi pretium leo et nisl aliquam mollis. Quisque arcu lorem, ultricies quis pellentesque nec, ullamcorper eu odio.
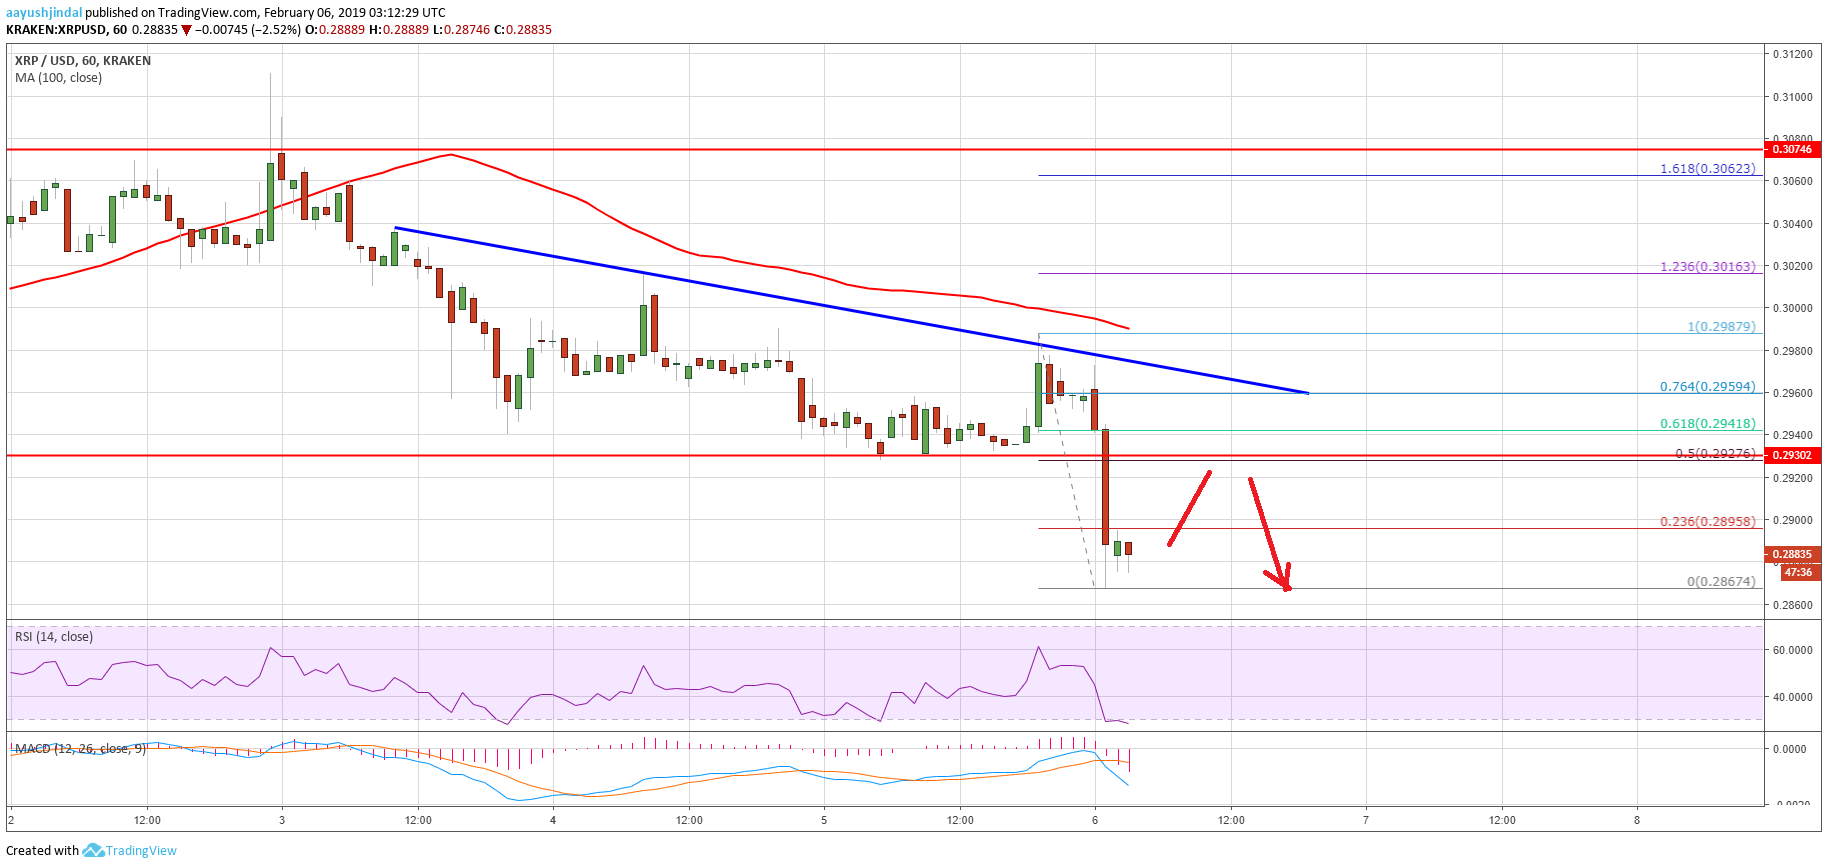
- Ripple price declined further and broke the $0.2940 and $0.2900 support levels against the US dollar.
- There is a key bearish trend line in place with resistance near $0.2960 on the hourly chart of the XRP/USD pair (data source from Kraken).
- The pair is trading in a bearish zone and it could continue to move down towards $0.2820 or $0.2800.
Ripple price accelerated losses against the US Dollar and Bitcoin. XRP/USD settled below $0.2940 and any recovery from the current levels could find a strong selling interest.
Ripple Price Analysis
There was a daily close below the $0.3000 support in ripple against the US Dollar. The XRP/USD pair declined further and broke many important supports near the $0.2900 level. Sellers were able to clear the key $0.2940 support and the 100 hourly simple moving average. It opened the doors for more losses and the price declined below the $0.2900 support level. It traded to a new monthly low at $0.2867 and it seems like sellers are in full control. At the moment, the price is consolidating losses above $0.2870, with no bullish angle.
An initial resistance is the 23.6% Fib retracement level of the recent decline from the $0.3110 high to $0.2940 low. However, the main resistances are near the $0.2920 and $0.2940 level. The previous support was also near $0.2940, which is likely to prevent gains. Besides, the 50% Fib retracement level of the recent decline from the $0.3110 high to $0.2940 low is near the $0.2930 level. Finally, there is a key bearish trend line in place with resistance near $0.2960 on the hourly chart of the XRP/USD pair. Therefore, if there is an upside correction, the price is likely to face sellers near $0.2920, $0.2930 and $0.2940.
Looking at the chart, ripple moved into a bearish zone below $0.2960. If sellers remain in action for a long time, there is a risk of a drop below the $0.2800 support level.
Technical Indicators
Hourly MACD – The MACD for XRP/USD is gaining momentum in the bearish zone.
Hourly RSI (Relative Strength Index) – The RSI for XRP/USD has reached the 20 level, with a bearish angle.
Major Support Level – $0.2850
Major Resistance Level – $0.2940


