
Reason to trust
How Our News is Made
Strict editorial policy that focuses on accuracy, relevance, and impartiality
Ad discliamer
Morbi pretium leo et nisl aliquam mollis. Quisque arcu lorem, ultricies quis pellentesque nec, ullamcorper eu odio.
- Ripple price is trading in a tight range above the $0.3240 and $0.3200 support levels against the US dollar.
- There is a major contracting triangle formed with resistance at $0.3290 on the hourly chart of the XRP/USD pair (data source from Kraken).
- The pair is likely to make the next move either above $0.3300 or below $0.3200 in the near term.
Ripple price is preparing for the next major move against the US Dollar and Bitcoin. XRP/USD could surge above $0.3300 as long as it is above the $0.3160 support area.
Ripple Price Analysis
During the past few hours, there were mainly range moves above the $0.3160 pivot in ripple price against the US Dollar. The XRP/USD pair traded a few points above the $0.3280 and $0.3300 resistance levels. However, there was no major upward move and the price topped near the $0.3340 level. Later, there was a downward move and the price declined below the $0.3260 support. There was also a break below the $0.3220 support and the 100 hourly simple moving average.
A low was formed at $0.3208 and later the price corrected higher. It recently broke the 50% Fib retracement level of the recent drop from the $0.3341 high to $0.3208 low. However, the upward move was capped by the $0.3280 and $0.3290 levels. The price also failed to clear the 61.8% Fib retracement level of the recent drop from the $0.3341 high to $0.3208 low. At the outset, there is a major contracting triangle formed with resistance at $0.3290 on the hourly chart of the XRP/USD pair. A successful close above the $0.3290 and $0.3300 resistance levels may clear the path for more gains. The next major resistance is at $0.3380, above which the price may test $0.3600.
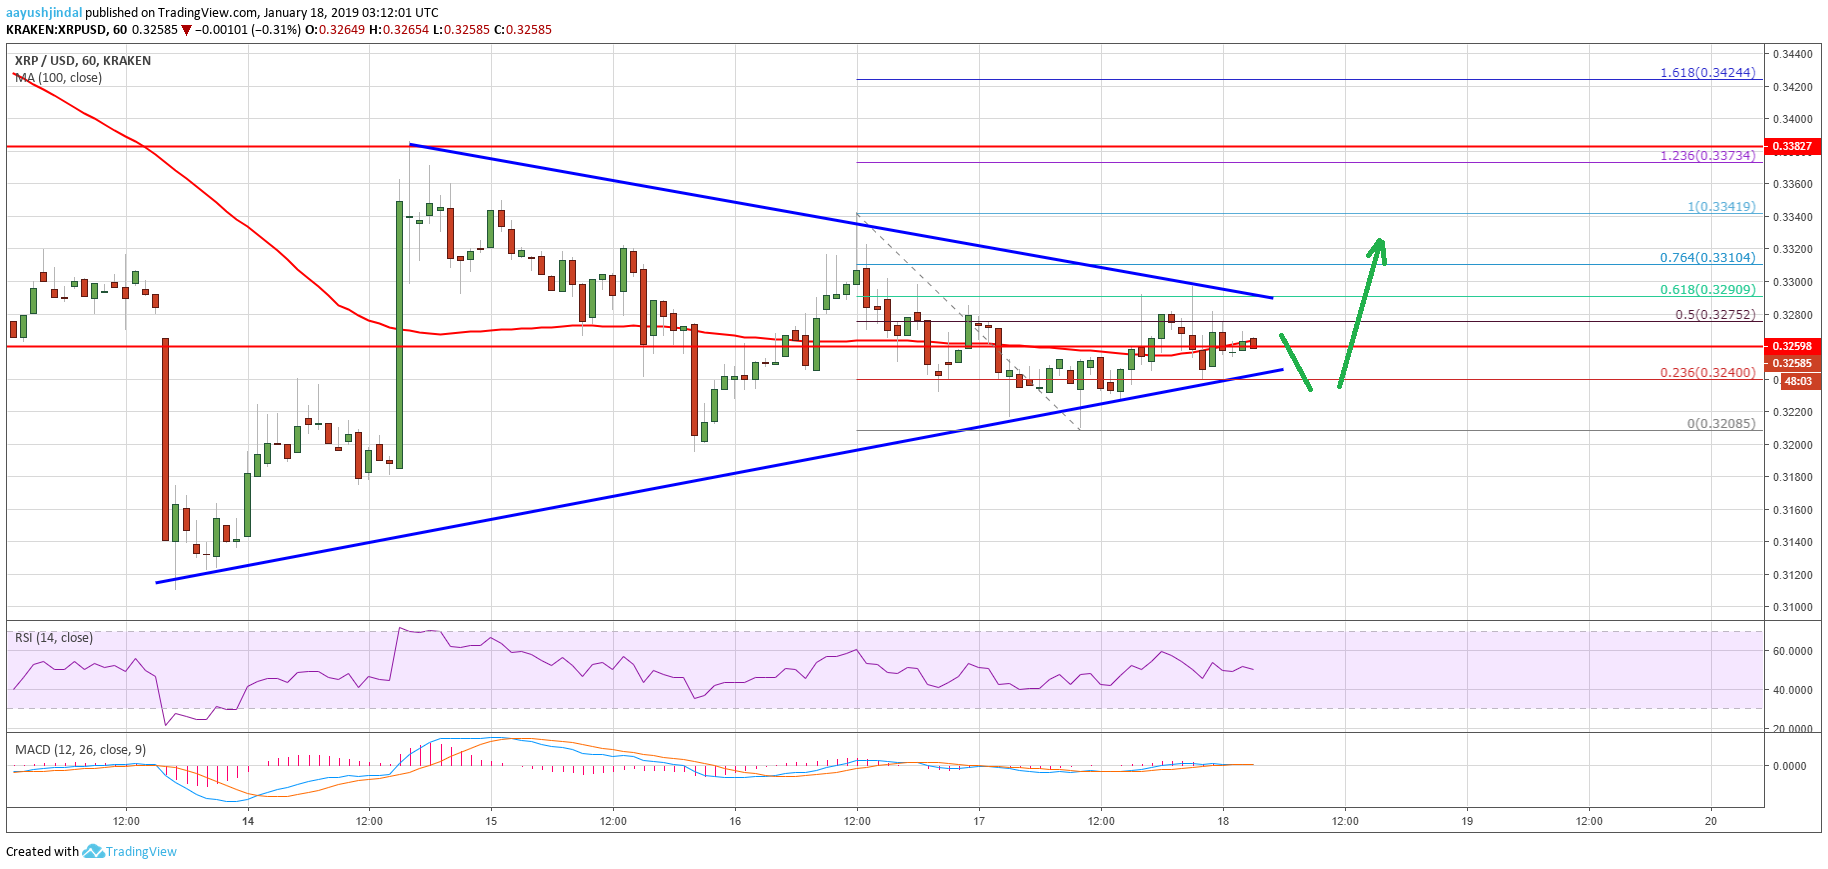
Looking at the chart, ripple price is clearly preparing for the next break either above $0.3300 or below $0.3200. As long as XRP is above $0.3160, there are high chances of a break above $0.3300.
Technical Indicators
Hourly MACD – The MACD for XRP/USD is currently flat, with no major bullish signal.
Hourly RSI (Relative Strength Index) – The RSI for XRP/USD is flirting with the 50 level, with a few bearish signs.
Major Support Level – $0.3160
Major Resistance Level – $0.3300


