
Reason to trust
How Our News is Made
Strict editorial policy that focuses on accuracy, relevance, and impartiality
Ad discliamer
Morbi pretium leo et nisl aliquam mollis. Quisque arcu lorem, ultricies quis pellentesque nec, ullamcorper eu odio.
- Ripple price traded lower recently and tested the $0.3580 support against the US dollar.
- There is a major bullish trend line with support at $0.3530 on the hourly chart of the XRP/USD pair (data source from Kraken).
- The pair could recover above $0.3650 as long as it is above the $0.3530 and $0.3580 supports.
Ripple price corrected lower recently against the US Dollar and Bitcoin. XRP/USD must stay above $0.3530 to start a fresh upward move in the near term.
Ripple Price Analysis
After forming a high near the $0.3760 level, ripple price started a downside correction against the US Dollar. The XRP/USD pair traded below the $0.3700 and $0.3650 supports levels. The decline was such that the price traded below the $0.3620 support as well. Sellers later pushed the price below the 50% Fib retracement level of the last leg from the $0.3470 low to $0.3761 high.
However, the price is now trading near the important $0.3580 support. The 100 hourly simple moving average is also positioned near the $0.3580 level. Besides, the 61.8% Fib retracement level of the last leg from the $0.3470 low to $0.3761 high is at $0.3581. Therefore, the $0.3580 support holds a lot of significance for buyers in the near term. If there is a break below $0.3580, the price may drop towards the $0.3530 support. There is also a major bullish trend line with support at $0.3530 on the hourly chart of the XRP/USD pair. The trend line support at $0.3530 is close to the 76.4% Fib retracement level of the last leg. On the upside, an initial resistance is near $0.3620 and a bearish trend line on the same chart.
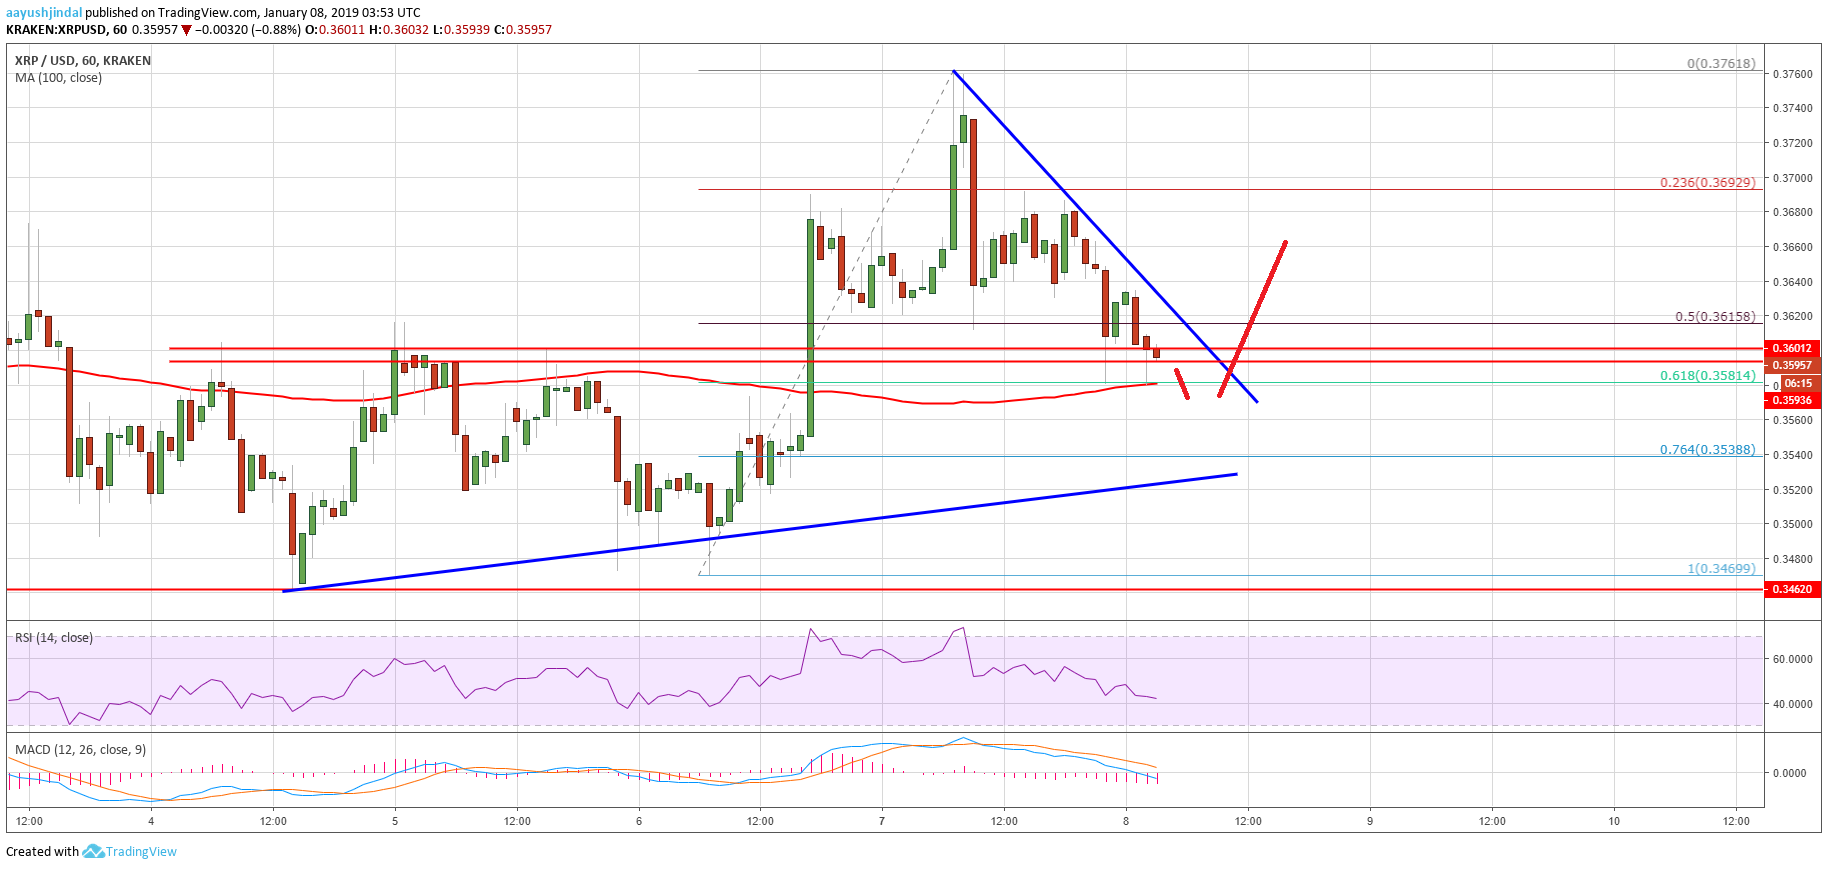
Looking at the chart, ripple price is clearly trading near a major support at $0.3580. As long as it is trading above the $0.3580 and $0.3530 supports, there are chances of a recovery.
Technical Indicators
Hourly MACD – The MACD for XRP/USD is now placed heavily in the bearish zone, signaling more losses.
Hourly RSI (Relative Strength Index) – The RSI for XRP/USD is now well below the 50 level, which is a negative sign.
Major Support Level – $0.3580
Major Resistance Level – $0.3620


