
Reason to trust
How Our News is Made
Strict editorial policy that focuses on accuracy, relevance, and impartiality
Ad discliamer
Morbi pretium leo et nisl aliquam mollis. Quisque arcu lorem, ultricies quis pellentesque nec, ullamcorper eu odio.
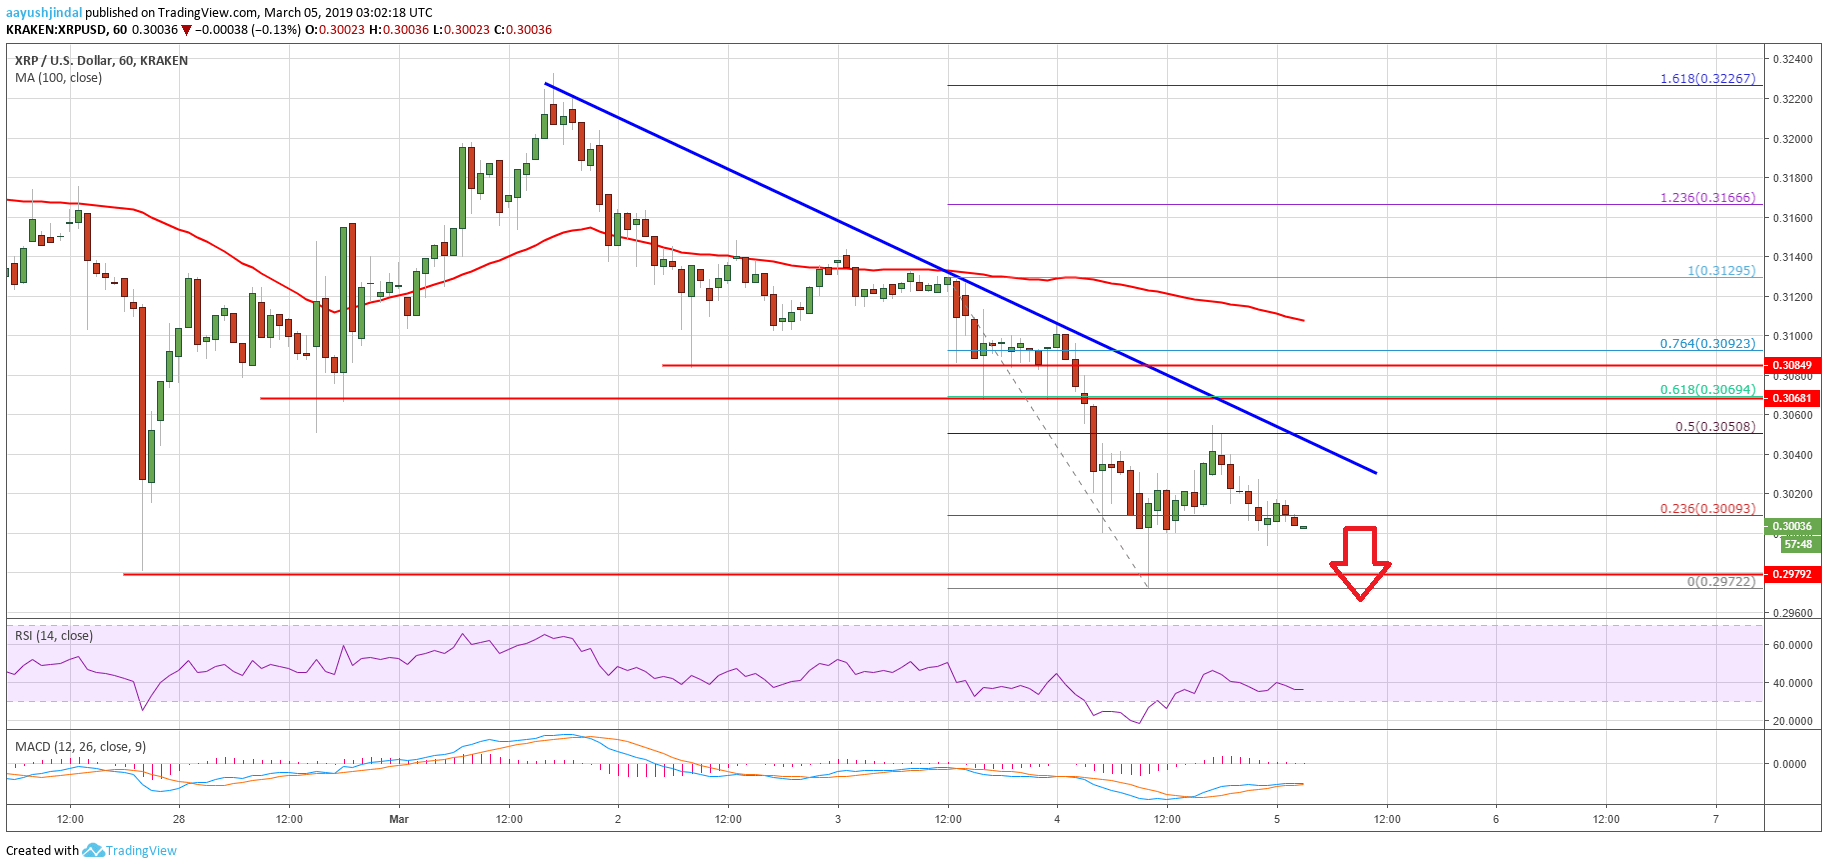
- Ripple price is following a declining path and it broke the $0.3100 support against the US dollar.
- The price remains at a risk of a sharp decline below $0.3000 and $0.2980 in the near term.
- There is a major bearish trend line formed with resistance near the $0.3040 level on the hourly chart of the XRP/USD pair (data source from Kraken).
- The pair remains in a downtrend and sellers remain in action below $0.3040 and $0.3080.
Ripple price declined below key supports against the US Dollar and bitcoin. XRP/USD could decline sharply below $0.3000 and $0.2980 to test the $0.2850 support level.
Ripple Price Analysis
In the past few days, there was a steady decline in ripple price from the $0.3200 swing high against the US Dollar. The XRP/USD pair traded below the $0.3150 and $0.3100 support levels to enter a bearish zone. There was even a close below the $0.3080 support and the 100 hourly simple moving average. Recently, the price even broke the $0.3050 and $0.3040 support levels. Finally, it spiked below the $0.3000 support and a new monthly low was formed at $0.2972.
Later, the price corrected higher and traded above the $0.3000 level. It surpassed the 23.6% Fib retracement level of the recent drop from the $0.3129 high to $0.2972 low. However, the previous support near the $0.3050 level acted as a strong resistance. Besides, the 50% Fib retracement level of the recent drop from the $0.3129 high to $0.2972 low acted as a resistance. More importantly, there is a major bearish trend line formed with resistance near the $0.3040 level on the hourly chart of the XRP/USD pair.
The pair declined again and it is currently trading below the $0.3020 level. It seems like there is a risk of a sharp decline below the $0.3000 and $0.2970 levels. The next key support is near $0.2850, where buyers might appear. On the upside, the price may continue to face sellers near $0.3040 and $0.3050. To start a recovery, the price must break $0.3050 and then $0.3080 in the near term.
Looking at the chart, ripple price is following a bearish structure from well above $0.3200. If sellers gain pace below the $0.3000 support, there could be a nasty drop towards $0.2850. The overall price action is suggesting more losses in bitcoin, Ethereum, XRP and other cryptocurrencies in the coming sessions.
Technical Indicators
Hourly MACD – The MACD for XRP/USD is about to move into the bearish zone, suggesting more losses ahead.
Hourly RSI (Relative Strength Index) – The RSI for XRP/USD is currently near the 40 level, with a minor bullish angle.
Major Support Levels – $0.3000, $0.2975 and $0.2850.
Major Resistance Levels – $0.3040, $0.3050 and $0.3080.


