
Reason to trust
How Our News is Made
Strict editorial policy that focuses on accuracy, relevance, and impartiality
Ad discliamer
Morbi pretium leo et nisl aliquam mollis. Quisque arcu lorem, ultricies quis pellentesque nec, ullamcorper eu odio.
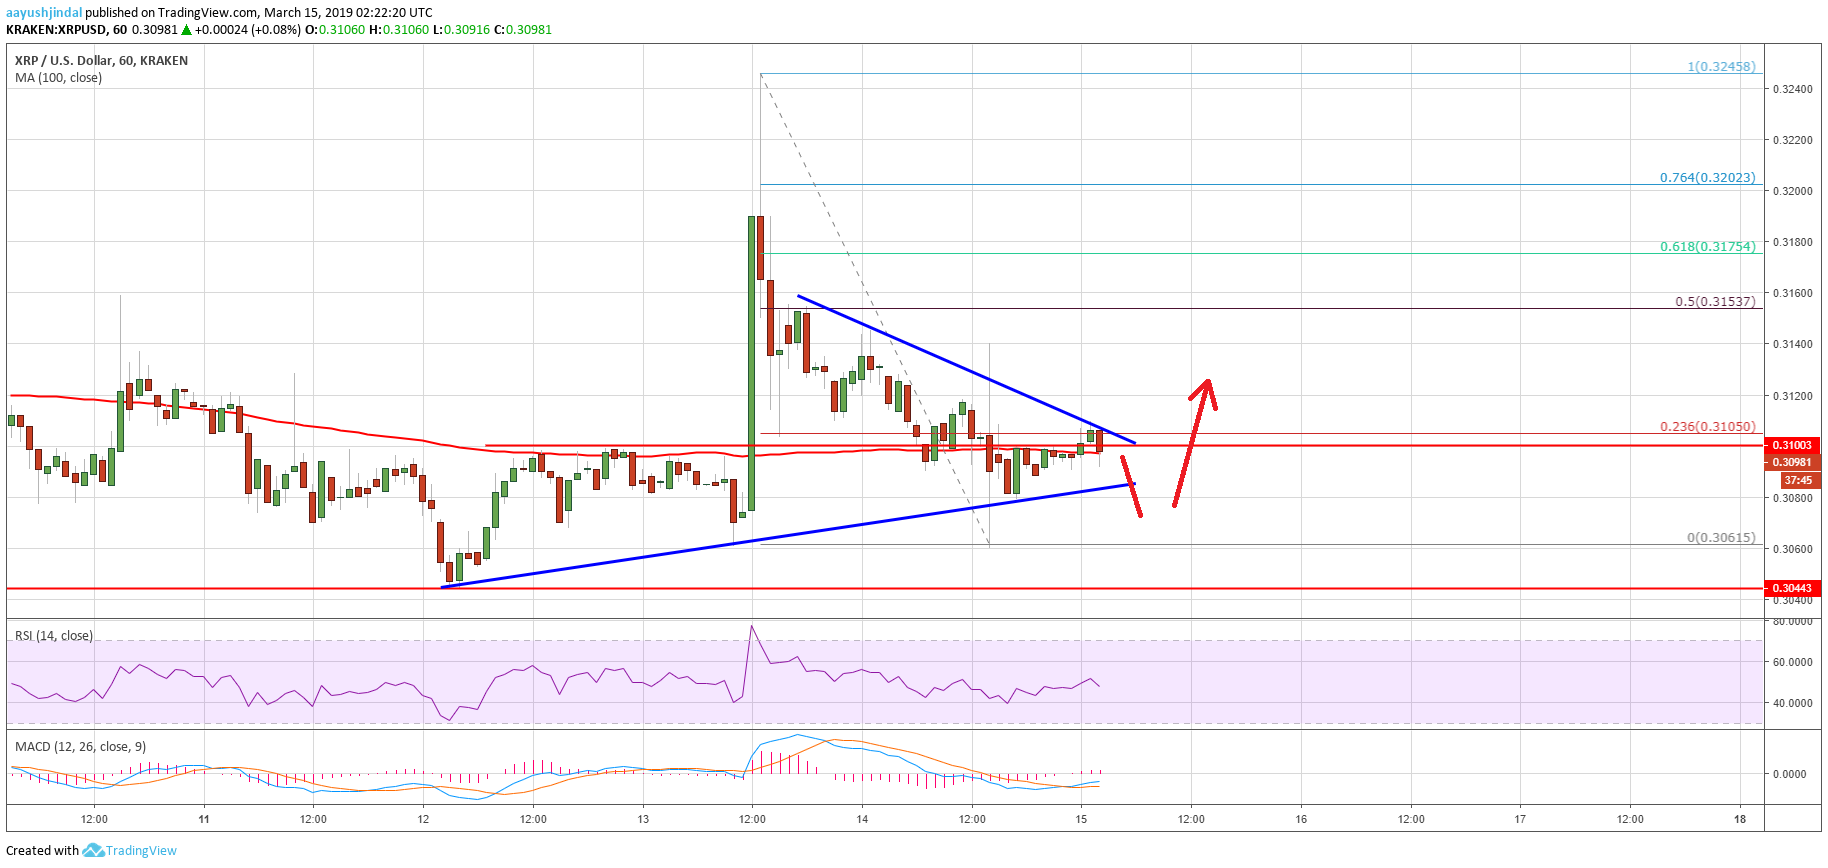
- Ripple price failed to hold gains above the $0.3120 and $0.3100 supports against the US dollar.
- The price tested the $0.3060 support and it is currently trading near the $0.3100 pivot level.
- There is a key contracting triangle in place with resistance at $0.3110 on the hourly chart of the XRP/USD pair (data source from Kraken).
- The pair could either dip sharply below $0.3060 or it may rise above the $0.3110 and $0.3120 resistances.
Ripple price trimmed its recent gains and declined against the US Dollar and bitcoin. XRP/USD might accelerate losses if it fails to break the $0.3120 resistance level in the near term.
Ripple Price Analysis
Yesterday, we saw a nice upward move in ripple price above the $0.3150 and $0.3200 resistances against the US Dollar. The XRP/USD pair even tested the $0.3250 level, but it failed to hold gains. As a result, there was a sharp decline below the $0.3200 and $0.3150 levels. The price even spiked below the $0.3120 support and the 100 hourly simple moving average. A swing low was formed at $0.3060 before the price corrected higher during BTC and Ethereum recovery.
The price moved above the $0.3080 level and tested the 23.6% Fib retracement level of the recent drop from the $0.3245 high to $0.3061 low. However, the price seems to be facing a strong resistance near the $0.3105 level and the 100 hourly SMA. Besides, there is a key contracting triangle in place with resistance at $0.3110 on the hourly chart of the XRP/USD pair. If the pair manages to climb above the $0.3110 and $0.3120 resistance levels, there could be a decent recovery.
The next resistance is near the $0.3150 level. It represents the 50% Fib retracement level of the recent drop from the $0.3245 high to $0.3061 low. On the other hand, if the price fails to move above the $0.3110 resistance, there may be a sharp dip. The $0.3060 support is crucial, below which the price might decline heavily. The next key supports are near $0.3040 and $0.3015.
Looking at the chart, ripple price is currently trading near a crucial juncture below the $0.3110 resistance. If buyers fail to gain strength, the price might start a nasty decline below $0.3060. In the short term, there could be range moves before the price either climbs above $0.3120 or revisits the $0.3060 support level.
Technical Indicators
Hourly MACD – The MACD for XRP/USD is slowly moving back into the bullish zone.
Hourly RSI (Relative Strength Index) – The RSI for XRP/USD is struggling to stay above the 50 level and moving lower with a bearish angle.
Major Support Levels – $0.3060, $0.3040 and $0.3015.
Major Resistance Levels – $0.3110, $0.3120 and $0.3150.


