
Reason to trust
How Our News is Made
Strict editorial policy that focuses on accuracy, relevance, and impartiality
Ad discliamer
Morbi pretium leo et nisl aliquam mollis. Quisque arcu lorem, ultricies quis pellentesque nec, ullamcorper eu odio.
- Ripple price is struggling to gain momentum above the $0.3300 and $0.3320 resistances against the US dollar.
- There is a key bullish trend line formed with support at $0.3240 on the hourly chart of the XRP/USD pair (data source from Kraken).
- The pair could break to the downside if sellers push the price below $0.3200 and $0.3150.
Ripple price is slowly moving into a bearish zone against the US Dollar and Bitcoin. XRP/USD could accelerate losses if buyers continue to struggle above $0.3300 in the near term.
Ripple Price Analysis
Recently, there was a dip below the $0.3250 and $0.3200 supports in ripple price against the US Dollar. The XRP/USD pair traded as low as $0.3192 and later corrected higher. It moved above the $0.3220 and $0.3250 resistance levels. There was a break above the 50% Fib retracement level of the last slide from the $0.3383 high to $0.3192 low. Moreover, there was a break above the $0.3300 level and the 100 hourly simple moving average.
Buyers also pushed the price above a connecting bearish trend line with resistance at $0.3260 on the hourly chart of the XRP/USD pair. However, the upside move was capped by the $0.3320 and $0.3330 resistance levels. The price also failed to settle above the 61.8% Fib retracement level of the last slide from the $0.3383 high to $0.3192 low. As a result, there was a fresh decline below the $0.3300 level and the 100 hourly simple moving average. At the outset, the price is trading near a key bullish trend line with support at $0.3240 on the same chart. If there is a downside break below the trend line and $0.3220, the price could accelerate losses.
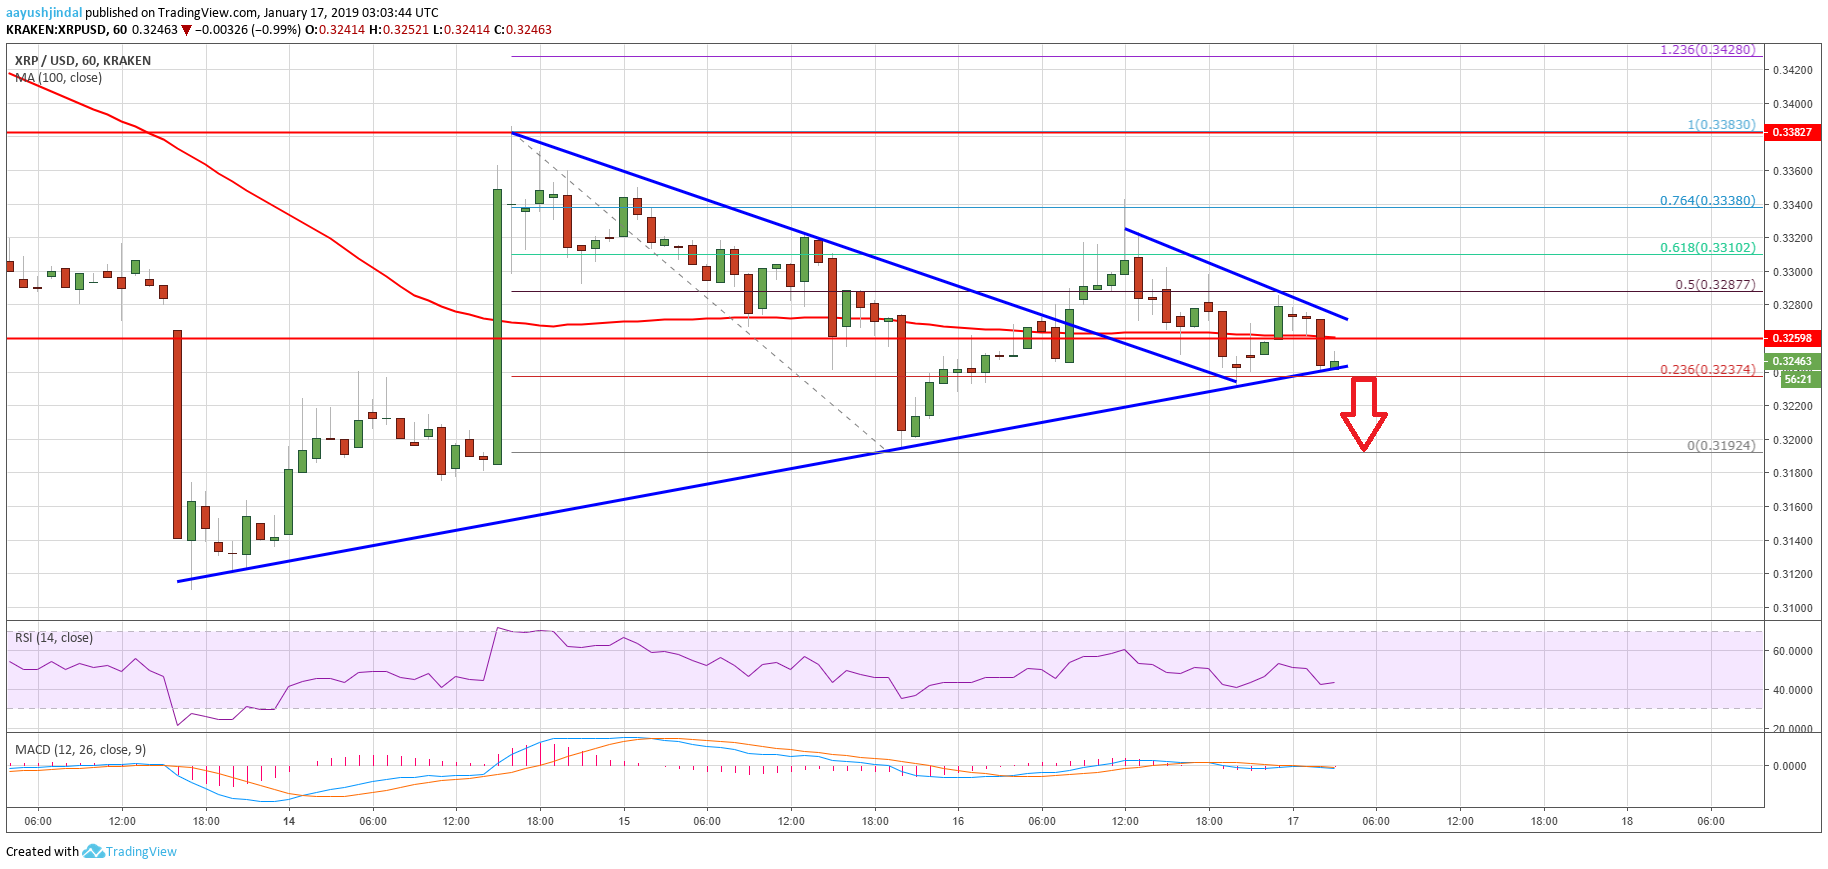
Looking at the chart, ripple price seems to be slowly moving into a bearish zone below $0.3250. If buyers continue to struggle, there could be more declines below $0.3200. The next key supports are $0.3150 and $0.3105.
Technical Indicators
Hourly MACD – The MACD for XRP/USD is showing a few negative signs in the bearish zone.
Hourly RSI (Relative Strength Index) – The RSI for XRP/USD is currently well below the 50 level.
Major Support Level – $0.3200
Major Resistance Level – $0.3300


