
Reason to trust
How Our News is Made
Strict editorial policy that focuses on accuracy, relevance, and impartiality
Ad discliamer
Morbi pretium leo et nisl aliquam mollis. Quisque arcu lorem, ultricies quis pellentesque nec, ullamcorper eu odio.
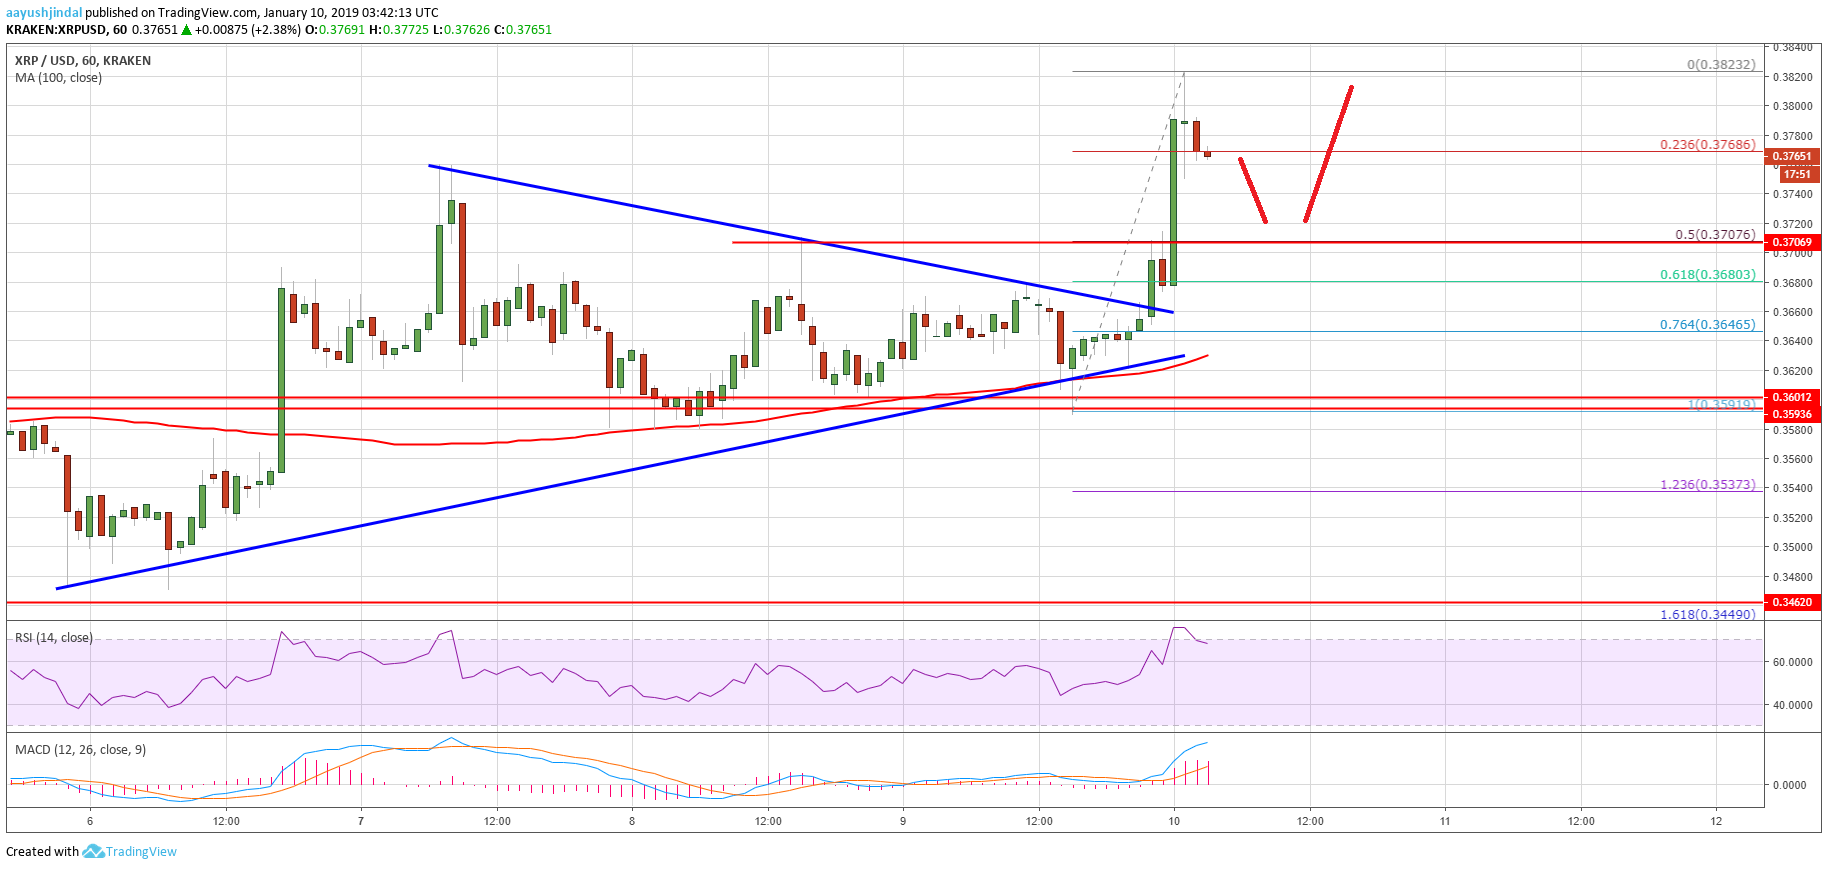
- Ripple price recently gained bullish momentum above the $0.3650 resistance against the US dollar.
- There was a break above a key triangle with resistance at $0.3665 on the hourly chart of the XRP/USD pair (data source from Kraken).
- The pair traded towards the $0.3840 level and it is currently correcting lower.
Ripple price is back in a positive zone against the US Dollar and Bitcoin. XRP/USD could dip a few points towards the $0.3700 support before a fresh upward move in the near term.
Ripple Price Analysis
Yesterday, we discussed a possible upward move above $0.3680 in ripple price against the US Dollar. The XRP/USD pair did gain bullish momentum and traded above the $0.3600 and $0.3650 resistance levels. It also cleared the 76.4% Fib retracement level of the last slide from the $0.3760 high to $0.3580 low. More importantly, there was a proper close above the $0.3680 resistance and the 100 hourly simple moving average.
Finally, there was a break above a key triangle with resistance at $0.3665 on the hourly chart of the XRP/USD pair. It opened the doors for more gains and the price traded above $0.3800. A new intraday high was formed at $0.3823 and later the price corrected lower. It is currently trading below $0.3800 and $0.3780 levels. Sellers pushed the price below the 23.6% Fib retracement level of the recent wave from the $0.3591 low to $0.3823 high. However, there are many supports on the downside near the $0.3720 and $0.3700 levels. Besides, the 50% Fib retracement level of the recent wave from the $0.3591 low to $0.3823 high is at $0.3706.
Looking at the chart, ripple price is currently placed nicely in a positive zone above the $0.3680 level. In the short term, there could be a few bearish moves, but the $0.3700 support could act as a support. On the upside, the price may soon break $0.3850 and $0.3900.
Technical Indicators
Hourly MACD – The MACD for XRP/USD is gaining momentum in the bullish zone, signaling more gains.
Hourly RSI (Relative Strength Index) – The RSI for XRP/USD is currently placed well above the 60 level.
Major Support Level – $0.3700
Major Resistance Level – $0.3840


