
Reason to trust
How Our News is Made
Strict editorial policy that focuses on accuracy, relevance, and impartiality
Ad discliamer
Morbi pretium leo et nisl aliquam mollis. Quisque arcu lorem, ultricies quis pellentesque nec, ullamcorper eu odio.
- Ripple price tested the $0.3050 support level and later bounced back above $0.3120 against the US dollar.
- There was a break above a major bearish trend line with resistance at $0.3160 on the hourly chart of the XRP/USD pair (data source from Kraken).
- The pair is currently placed nicely above $0.3160, but it must break the $0.3220 resistance for more gains.
Ripple price started a decent recovery against the US Dollar and Bitcoin. XRP/USD is now facing a major hurdle near $0.3220 and the 100 hourly simple moving average.
Ripple Price Analysis
Recently, there was a sharp downside reaction below the $0.3100 support level in ripple price against the US Dollar. The XRP/USD pair declined below the $0.3080 support and tested the $0.3050 area. A new weekly low was formed at $0.3047 and later the price bounced back nicely. It climbed above the $0.3080, $0.3100 and $0.3130 resistance levels to move into a positive zone. There was even a break above the 76.4% Fib retracement level of the last drop from the $0.3217 high to $0.3047 low.
Moreover, there was a break above a major bearish trend line with resistance at $0.3160 on the hourly chart of the XRP/USD pair. The pair retested the $0.3217 swing high and the 100 hourly simple moving average. However, there was no break above the $0.3220 resistance and the price is currently consolidating below the 100 hourly SMA. It seems like there could be a short term correction towards the $0.3160 or $0.3140 support levels. Later, the price may bounce back and attempt to surpass the $0.3220 barrier. The next stop for buyers could be near the $0.3320 level. It represents the 1.618 Fib extension level of the last drop from the $0.3217 high to $0.3047 low.
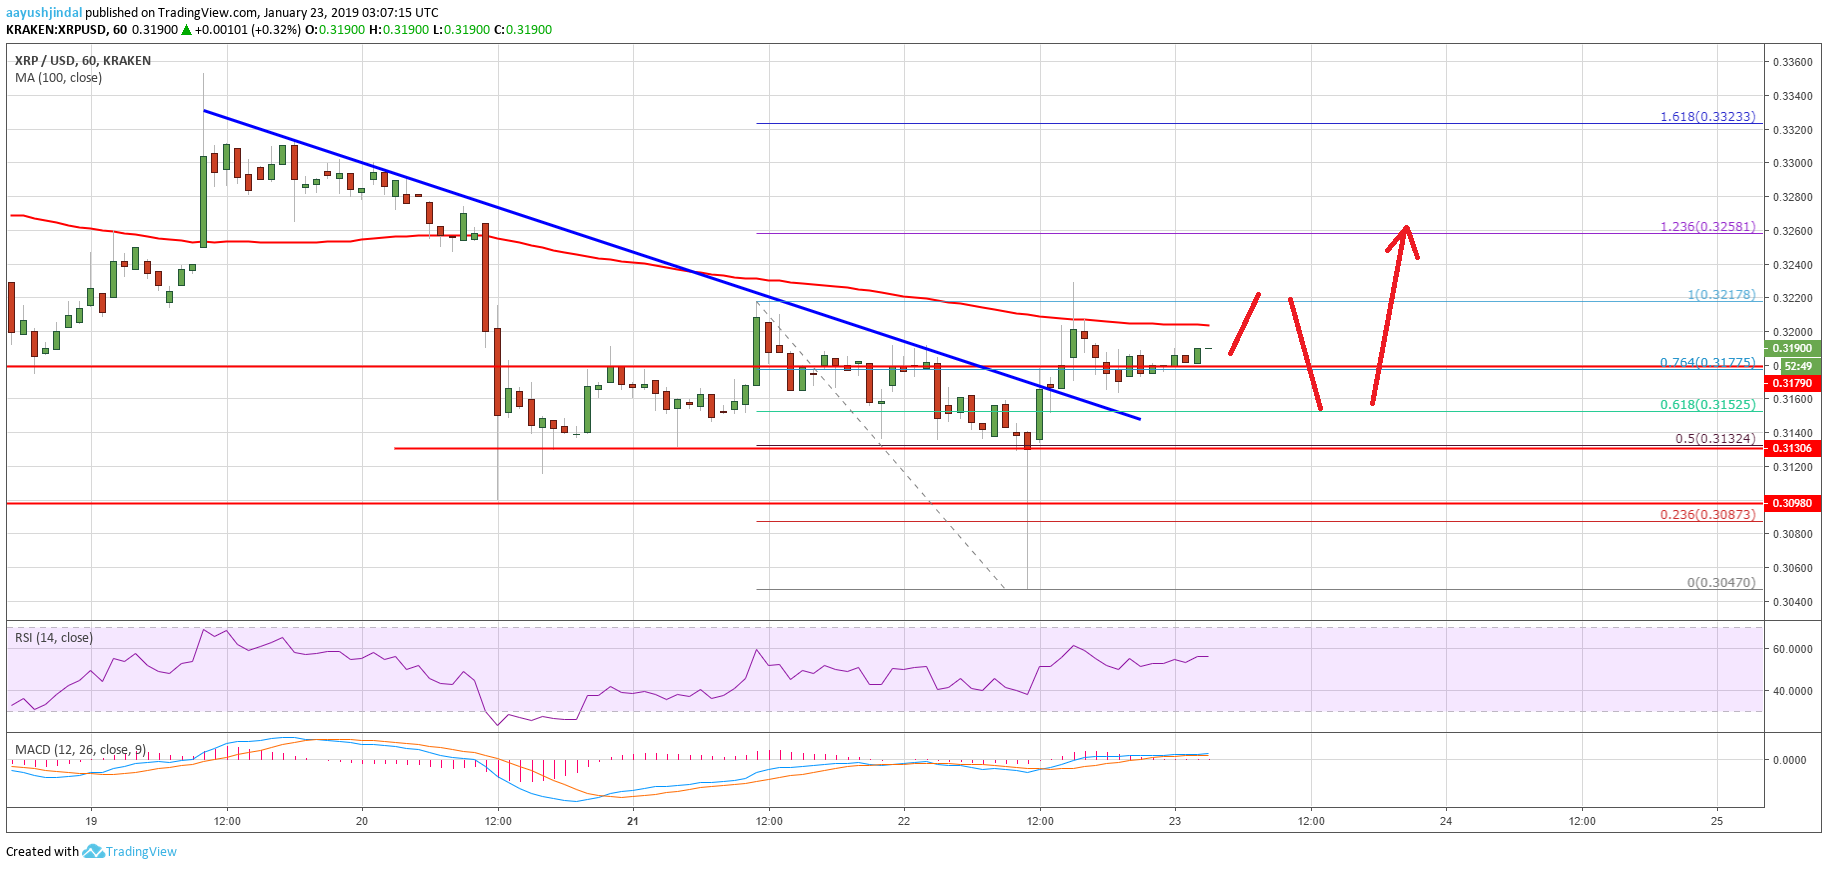
Looking at the chart, ripple price is slowly moving into a positive zone above $0.3180. However, a clear break above the $0.3220 barrier is must for more gains in the near term.
Technical Indicators
Hourly MACD – The MACD for XRP/USD is slowly moving into the bearish zone.
Hourly RSI (Relative Strength Index) – The RSI for XRP/USD is currently well above the 50 level.
Major Support Level – $0.3140
Major Resistance Level – $0.3220


