
Reason to trust
How Our News is Made
Strict editorial policy that focuses on accuracy, relevance, and impartiality
Ad discliamer
Morbi pretium leo et nisl aliquam mollis. Quisque arcu lorem, ultricies quis pellentesque nec, ullamcorper eu odio.
- Ripple price extended losses and broke the $0.3300 and $0.3200 support levels against the US dollar.
- There is a key connecting bearish trend line with resistance at $0.3275 on the hourly chart of the XRP/USD pair (data source from Kraken).
- The pair may correct a few points, but it remains at a risk of more losses below $0.3100 and $0.3000.
Ripple price declined heavily and broke major supports against the US Dollar and Bitcoin. XRP/USD may even break the $0.3000 support this week if it stays below the $0.3400 level.
Ripple Price Analysis
After trading in a range for some time below $0.3350, ripple price started a fresh decline against the US Dollar. The XRP/USD pair broke the $0.3220 range support to move further into a bearish zone. The price even traded below the $0.3150 level and settled well below the 100 hourly simple moving average. A new monthly low was formed at $0.3116 and the price is currently correcting higher. It moved above the $0.3200 level, but the previous support at $0.3220 is acting as a resistance.
Above $0.3220, the 23.6% Fib retracement level of the recent drop from the $0.3823 high to $0.3116 low is at $0.3280. Moreover, there is a key connecting bearish trend line with resistance at $0.3275 on the hourly chart of the XRP/USD pair. It seems like buyers are likely to struggle near $0.3280 and the bearish trend line. If they succeed, the previous range resistance at $0.3350 may act as a solid barrier. An intermediate resistance is $0.3320 and the 100 hourly simple moving average. Above the 100 hourly SMA and the $0.3350 resistance, the price may test the $0.3460 resistance.
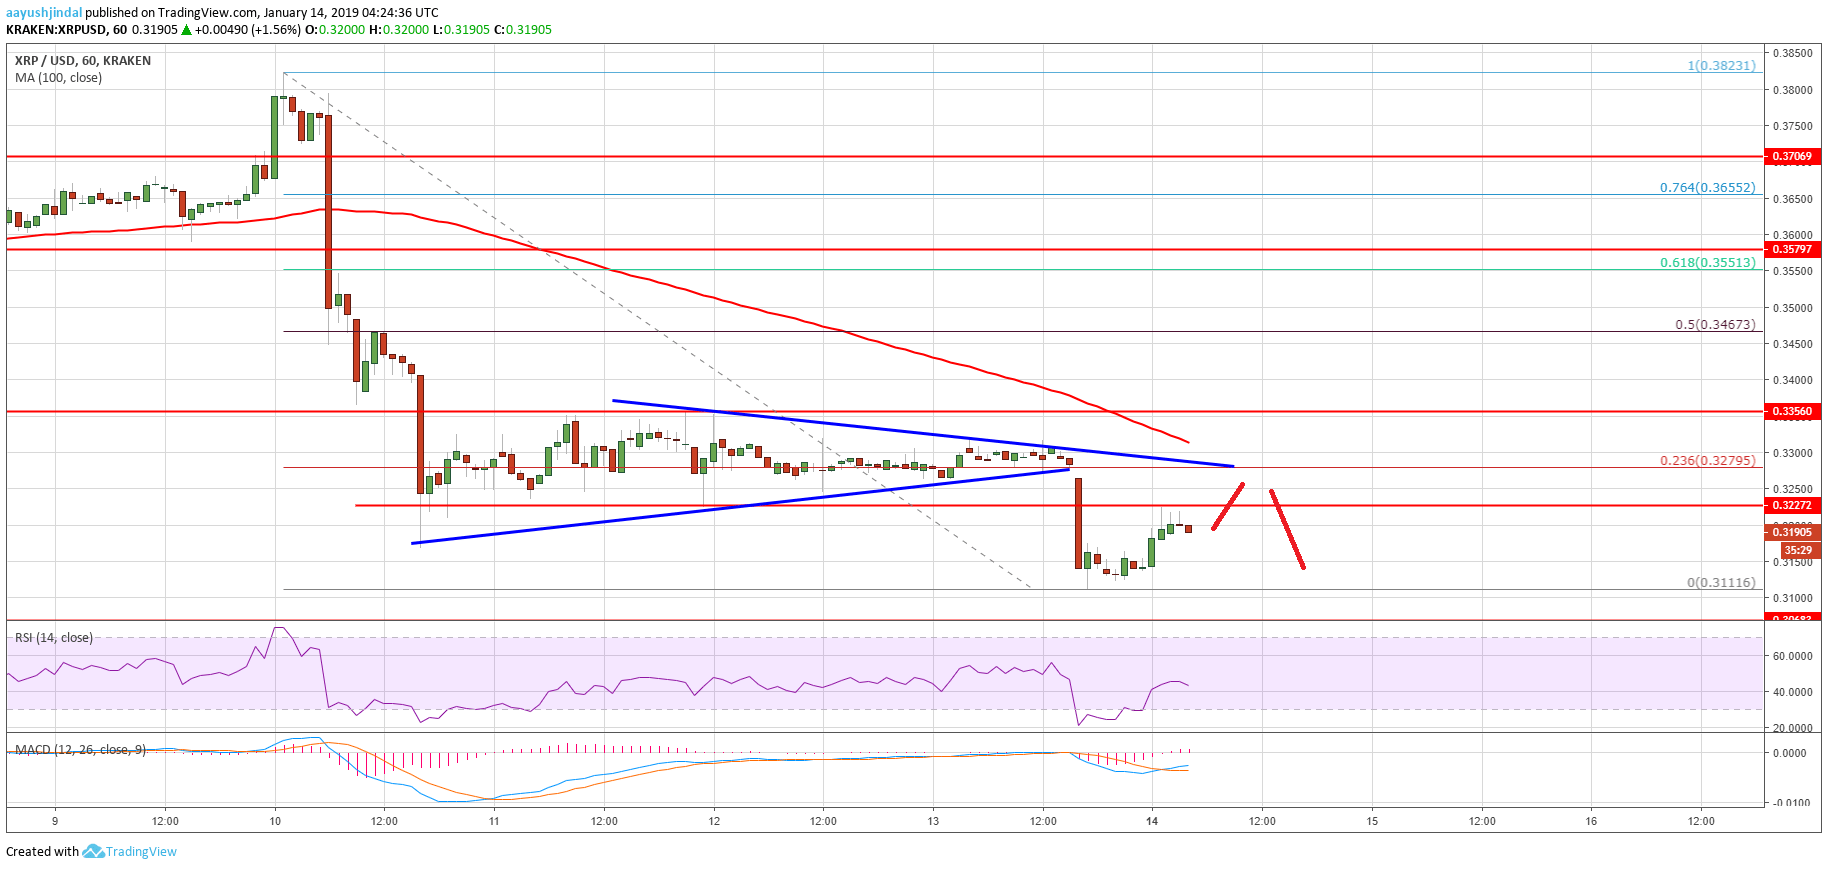
Looking at the chart, ripple price is trading in a strong downtrend below $0.3300 and $0.3350. Once the current correction is complete, the price may resume its decline below $0.3100 and $0.3050.
Technical Indicators
Hourly MACD – The MACD for XRP/USD is slowly moving in the bullish zone, but upsides may be limited.
Hourly RSI (Relative Strength Index) – The RSI for XRP/USD jumped above the 40 level, but it is struggling near 50.
Major Support Level – $0.3100
Major Resistance Level – $0.3280


