
Reason to trust
How Our News is Made
Strict editorial policy that focuses on accuracy, relevance, and impartiality
Ad discliamer
Morbi pretium leo et nisl aliquam mollis. Quisque arcu lorem, ultricies quis pellentesque nec, ullamcorper eu odio.
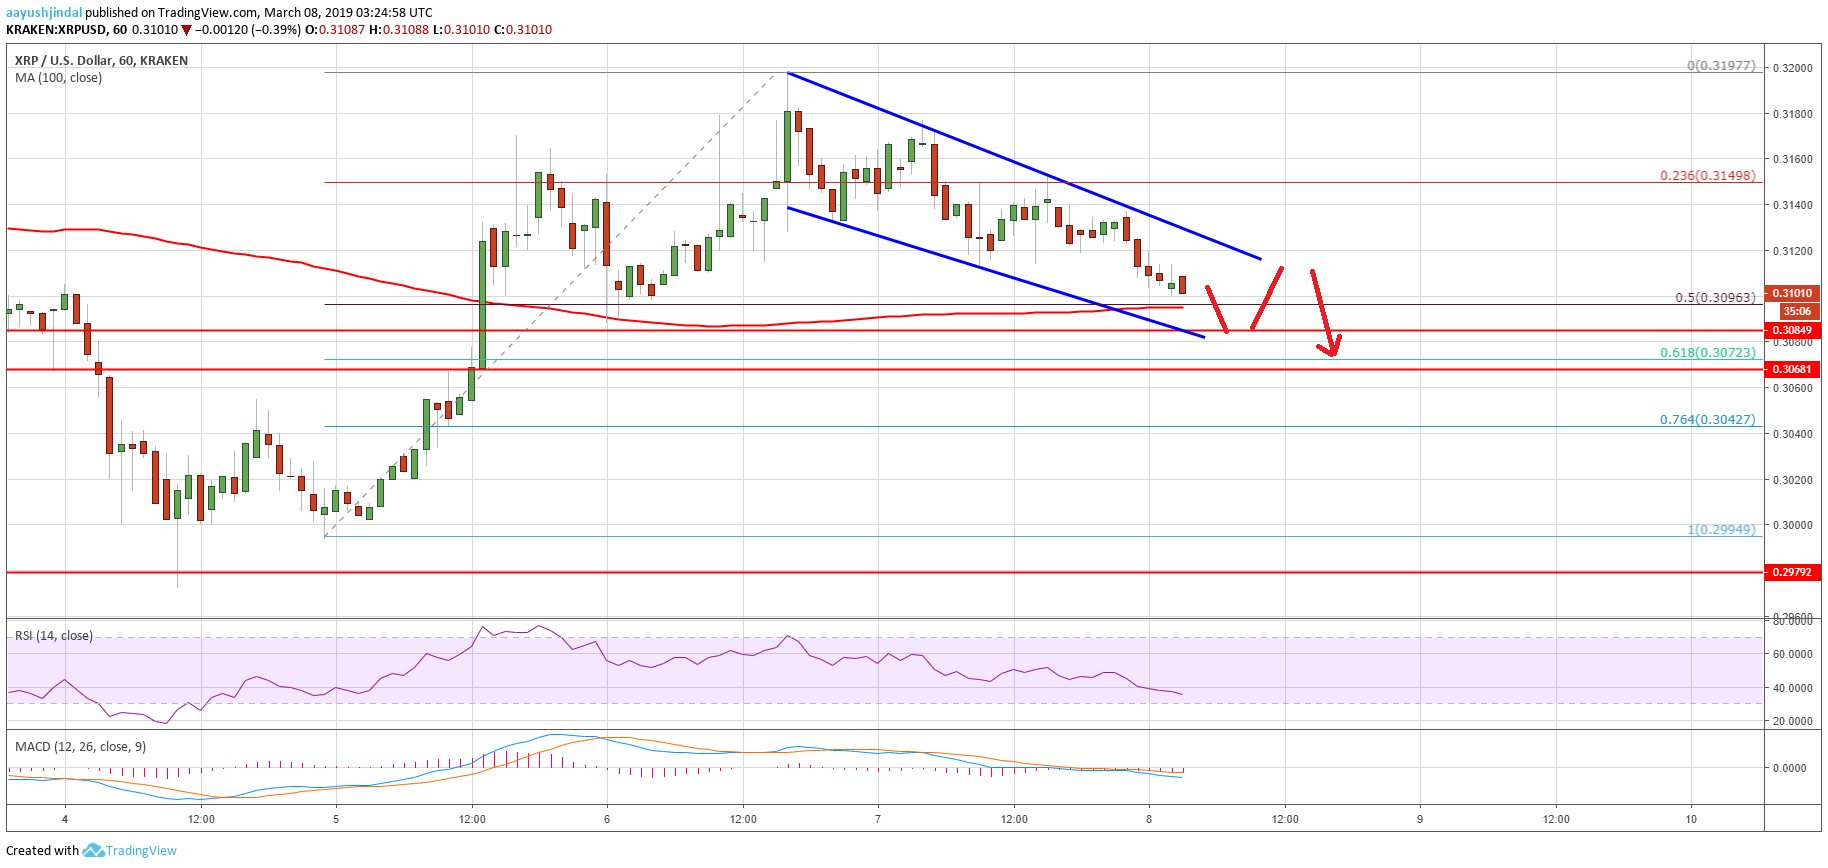
- Ripple price failed to surpass the $0.3200 resistance and started a downward move against the US dollar.
- The price traded below the $0.3140 support and it is now approaching the key $0.3080 support.
- There is a new declining channel formed with resistance at $0.3125 on the hourly chart of the XRP/USD pair (data source from Kraken).
- The pair is under pressure and it seems like it could tumble if there is a break below the 100 hourly SMA.
Ripple price is slowly grinding lower against the US Dollar and bitcoin. XRP/USD must stay above $0.3080 and the 100 hourly SMA to stage a comeback. If not, it could decline heavily towards $0.3020.
Ripple Price Analysis
After a decent upward move, ripple price faced a strong resistance near the $0.3200 level against the US Dollar. The XRP/USD pair formed a short-term top near the $0.3197 and later started a steady decline. The price broke the $0.3150 and $0.3140 support levels to move into a bearish zone. Besides, there was a break below the 23.6% Fib retracement level of the last wave from the $0.2994 low to $0.3197 high. Sellers took control and pushed the price below the $0.3120 support level.
However, the price is now approaching a crucial support near the $0.3080 level. It represents the 50% Fib retracement level of the last wave from the $0.2994 low to $0.3197 high. More importantly, the 100 hourly simple moving average is positioned near the $0.3080 support area. Therefore, there could be a strong buying interest near the $0.3075-0.3080 zone. If there is a downside break below $0.3080, the price is likely to move into a downtrend. The next key support is near the $0.3040 level and the 76.4% Fib retracement level of the last wave from the $0.2994 low to $0.3197 high.
At the outset, there is a new declining channel formed with resistance at $0.3125 on the hourly chart of the XRP/USD pair. The pair needs to overcome selling interest and clear the channel resistance $0.3130. However, the main resistance is at $0.3150, above which the price is likely to revisit the $0.3200 resistance area.
Looking at the chart, ripple price seems to be approaching a crucial juncture near $0.3080. It could turn out to be make-or-break support area. Therefore, traders need to keep a close watch on the $0.3075-0.3080 support area to grab the next move.
Technical Indicators
Hourly MACD – The MACD for XRP/USD is gaining pace in the bearish zone.
Hourly RSI (Relative Strength Index) – The RSI for XRP/USD declined and moved below the 50 level, with a bearish angle.
Major Support Levels – $0.3080, $0.3075 and $0.3040.
Major Resistance Levels – $0.3125, $0.3130 and $0.3150.


