
Reason to trust
How Our News is Made
Strict editorial policy that focuses on accuracy, relevance, and impartiality
Ad discliamer
Morbi pretium leo et nisl aliquam mollis. Quisque arcu lorem, ultricies quis pellentesque nec, ullamcorper eu odio.
- Ripple price gained traction and moved above the $0.3550 resistance against the US dollar.
- There was a break above a key bearish trend line with resistance at $0.3550 on the hourly chart of the XRP/USD pair (data source from Kraken).
- The pair remains well supported on dips near $0.3600 and it may continue to move higher.
Ripple price formed a decent support and recovered against the US Dollar and Bitcoin. XRP/USD could dip a few points before moving towards $0.3800.
Ripple Price Analysis
Recently, there was a downside correction below $0.3750 in ripple price against the US Dollar. The XRP/USD pair traded towards the $0.3460 support, which acted as a buy zone on many occasions. The price found a strong buying interest near $0.3460 and later recovered. It jumped above the $0.3500 and $0.3550 resistance levels. There was even a close above the $0.3600 level and the 100 hourly simple moving average.
Moreover, there was a break above a key bearish trend line with resistance at $0.3550 on the hourly chart of the XRP/USD pair. It traded close to the $0.3700 level and formed a high at $0.3689. Later, it started a downside correction and traded below the $0.3660 level. There was a break below the 23.6% Fib retracement level of the recent wave from the $0.3471 low to $0.3689 high. On the downside, there are many supports near the $0.3600 and $0.3580 levels. Besides, the 50% Fib retracement level of the recent wave from the $0.3471 low to $0.3689 high is placed near the $0.3580 level. Finally, the 100 hourly SMA is near $0.3570 to act as a strong support.
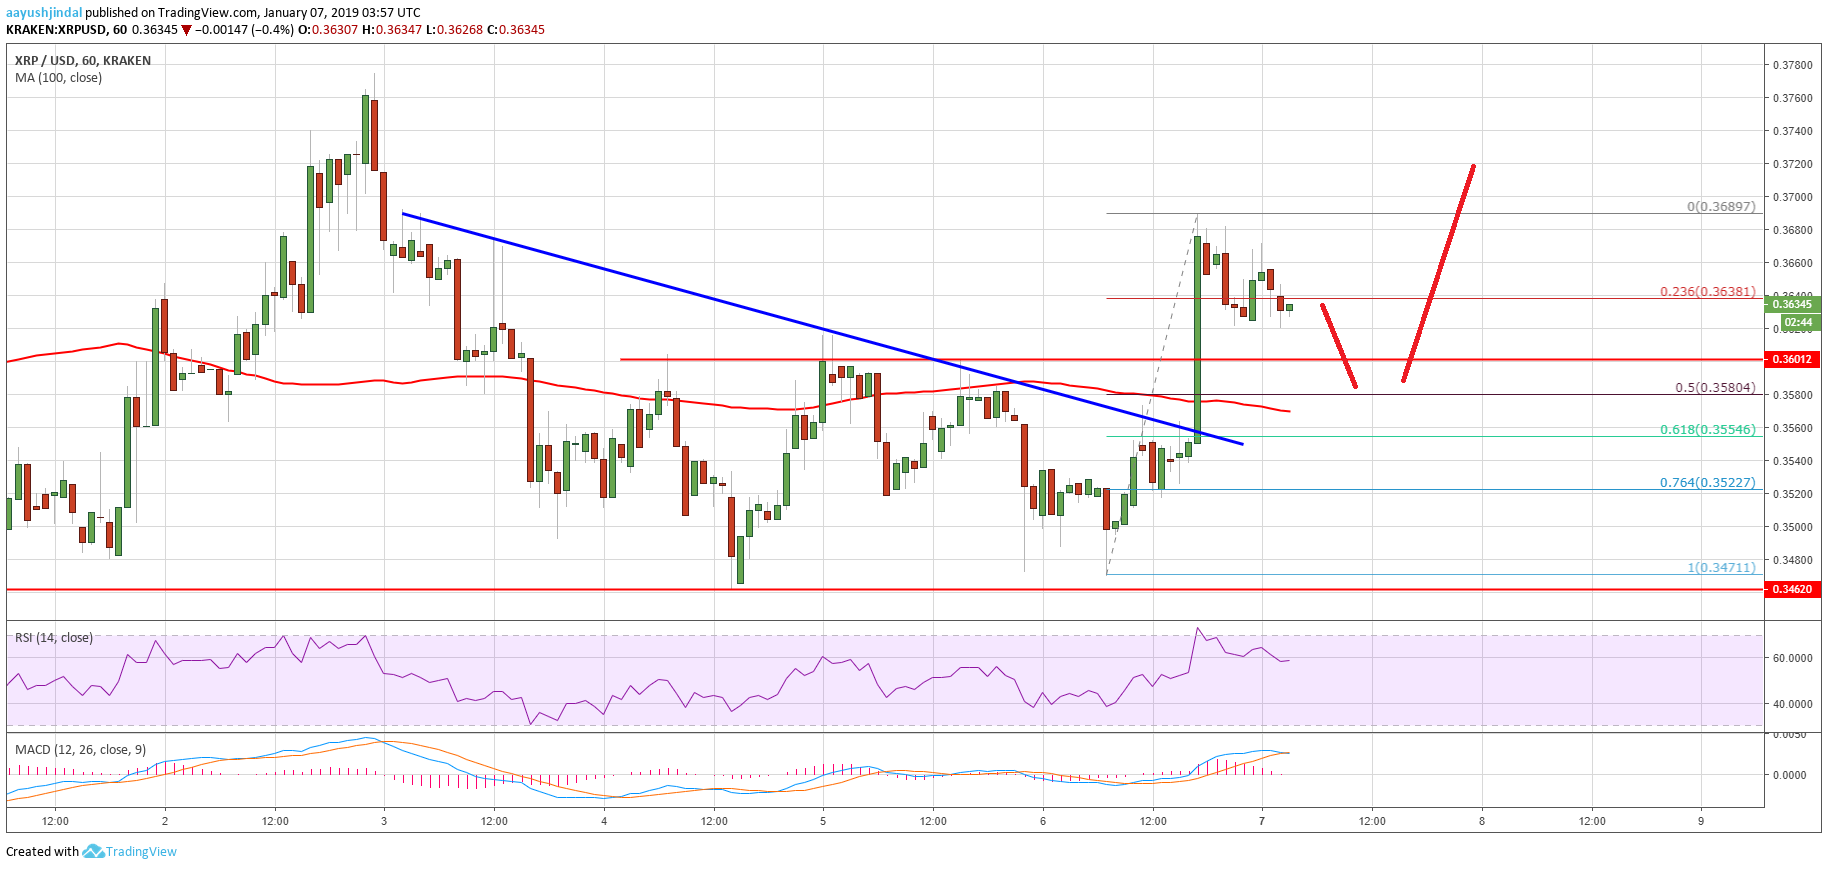
Looking at the chart, ripple price remains well supported above the $0.3550 level and the 100 hourly SMA. On the upside, the price must break the $0.3680 and $0.3700 resistance levels. The next main resistance is at $0.3800 followed by $0.3820.
Technical Indicators
Hourly MACD – The MACD for XRP/USD is slowly reducing its bullish slope, signaling slowness in buyer’s strength.
Hourly RSI (Relative Strength Index) – The RSI for XRP/USD is still well below the 60 level, which is a positive sign.
Major Support Level – $0.3550
Major Resistance Level – $0.3700


