
Reason to trust
How Our News is Made
Strict editorial policy that focuses on accuracy, relevance, and impartiality
Ad discliamer
Morbi pretium leo et nisl aliquam mollis. Quisque arcu lorem, ultricies quis pellentesque nec, ullamcorper eu odio.
Key Highlights
- Ripple price is struggling to clear the $0.4540 and $0.4550 resistance levels against the US dollar.
- There is a major bearish trend line in place with resistance at $0.4540 on the hourly chart of the XRP/USD pair (data source from Kraken).
- The pair must clear the $0.4540, $0.4550 and $0.4610 resistance levels to accelerate higher.
Ripple price is preparing for the next break against the US Dollar and Bitcoin. XRP/USD remains supported on dips near $0.4410 for an upside break.
Ripple Price Analysis
There were mostly range moves above the $0.4410 support level in ripple price against the US Dollar. The XRP/USD pair recently dipped after testing the $0.4610 resistance area. It declined below $0.4500 and the 100 hourly simple moving average. However, there was no test of the $0.4410 support and the price formed a low at $0.4439. Later, it recovered and moved above the $0.4500 level.
There was also a break above the 23.6% Fib retracement level of the last slide from the $0.4613 high to $0.4439 low. On the upside, there is a strong barrier formed near the $0.4540 and $0.4550 resistance levels. There is also a major bearish trend line in place with resistance at $0.4540 on the hourly chart of the XRP/USD pair. Besides, the 50% Fib retracement level of the last slide from the $0.4613 high to $0.4439 low is at $0.4526 to prevent upsides along with the 100 hourly SMA. Therefore, a proper break above the trend line and the $0.4550 resistance could open the doors for more gains in the near term.
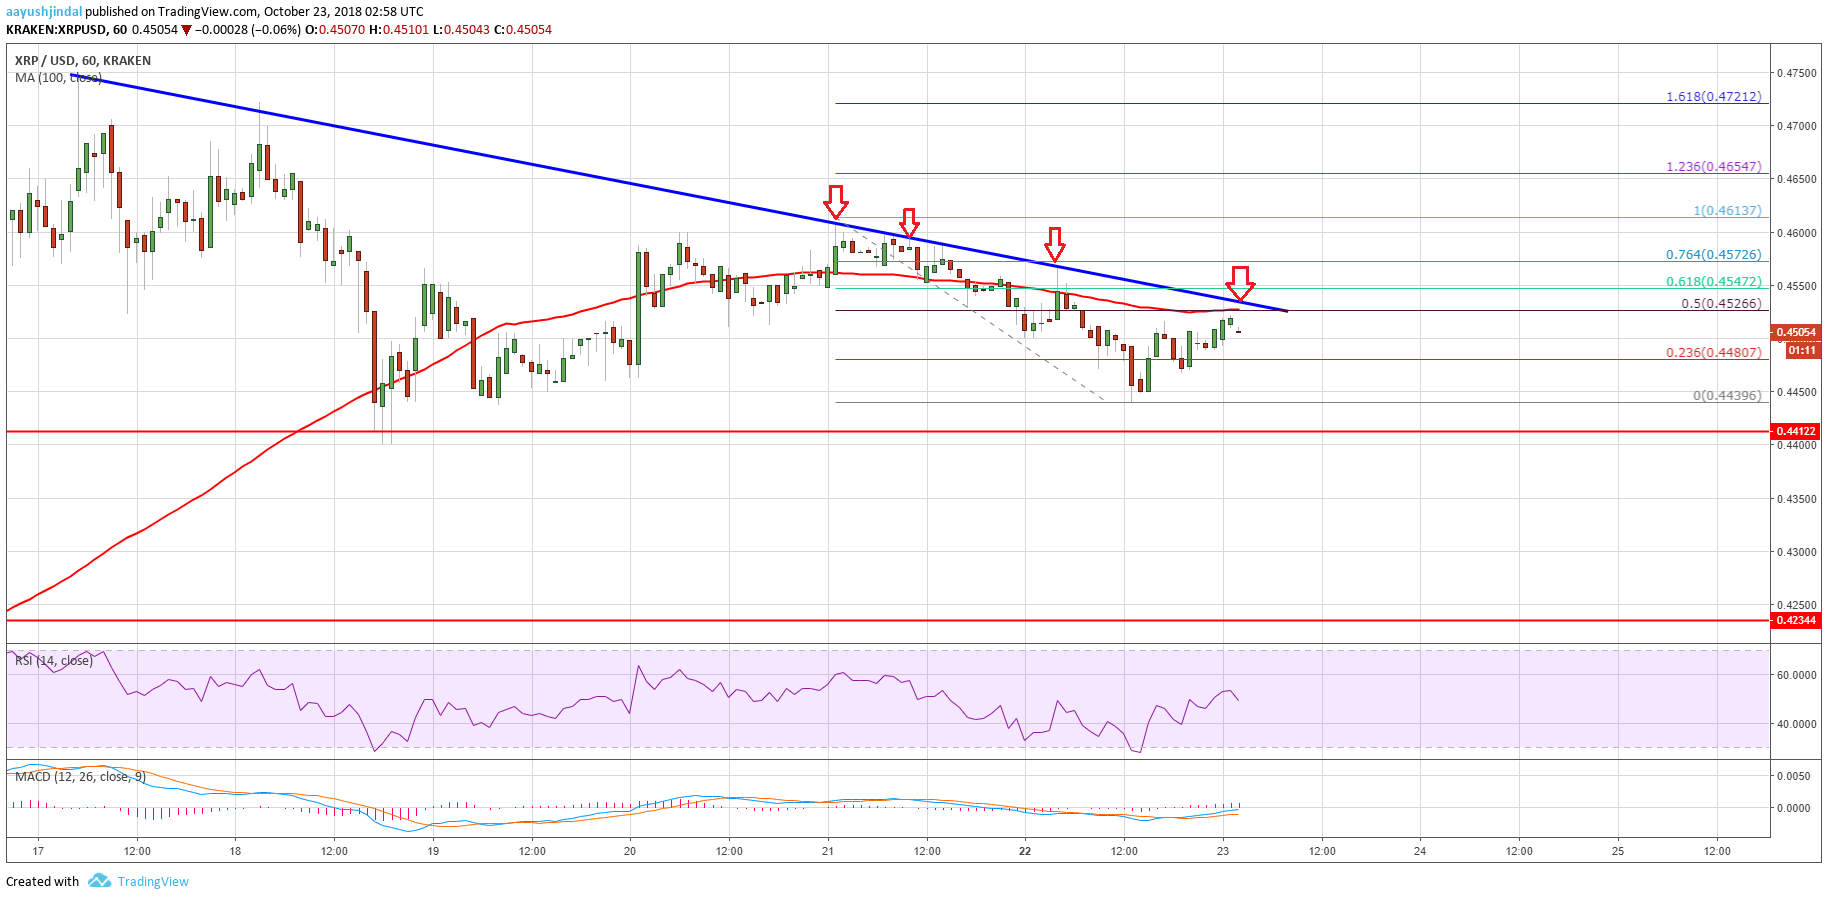
Looking at the chart, ripple price is well supported near the $0.4410 level. If there is a downside break below $0.4410 and $0.4400, the price may decline sharply towards $0.4200.
Looking at the technical indicators:
Hourly MACD – The MACD for XRP/USD is currently moving nicely in the bullish zone.
Hourly RSI (Relative Strength Index) – The RSI for XRP/USD is near the 50 level.
Major Support Level – $0.4410
Major Resistance Level – $0.4550


