

The fast scaling solution for Ethereum, Polygon (MATIC), has had an erratic ride this month. Following a savage price adjustment whereby MATIC fell almost 20%, a recent 24-hour rally has given the market some hope. But is this evidence of a complete recovery, or a brief respite before more loss?
Polygon’s Price Plunge: A Reality Check
Data from CoinMarketCap presents an ugly picture. Currently ranking at number 18, MATIC has been consistently declining down the top 20 cryptocurrency list. MATIC loses roughly a quarter of its value in the past 30 days, hence this fall corresponds with a notable price drop.
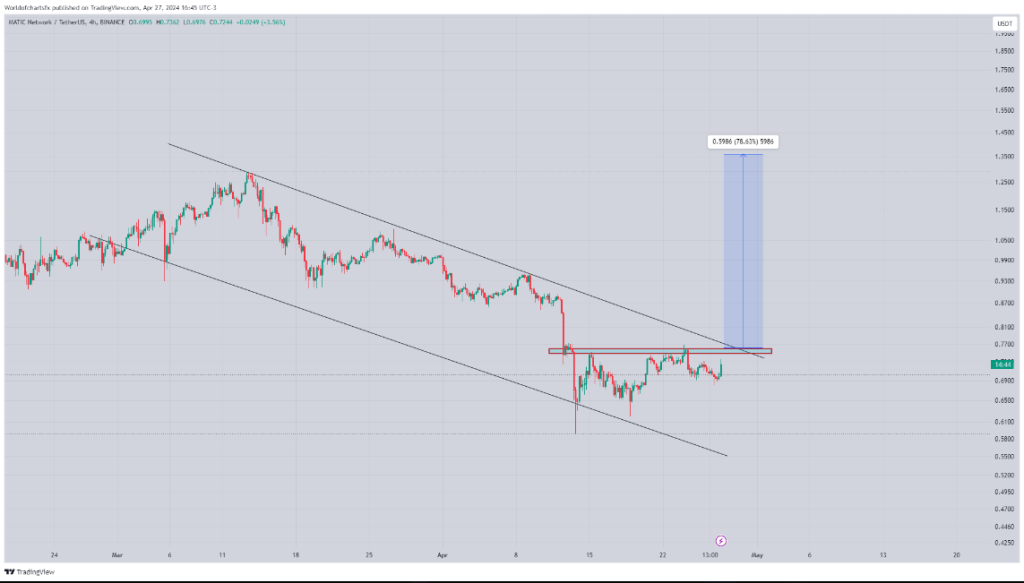
Classic sign of a bearish trend, analysts such as World of Charts highlight MATIC’s daily chart’s declining channel pattern. MATIC must cross a critical obstacle—the $0.77 resistance level—if it is to have a real price rebound. Though the climb won’t be easy, a breakout above this area might set off a notable bull run to the $1 dollar level.
$Matic#Matic Still Nothing Has Changed Consolidating In Descending Channel Successful Breakout Can Lead Massive Bullish Wave In Coming Days https://t.co/RBiSg4kaGb pic.twitter.com/fUwIbyW2hA
— World Of Charts (@WorldOfCharts1) April 27, 2024

Pulse On Investor Sentiment
For Polygon bulls, the past 24 hours have given a sliver of hope. Rising by five percent, the token price momentarily passed the $0.74 barrier. This increase corresponds with a change in the MVRV ratio, implying a growth in the count of lucrative MATIC investors.
Additionally, the bullish crossover on the MACD indicator hints at a potential increase in buying pressure. However, beneath the surface, some concerning trends remain.
MATIC market cap currently at $6.8 billion. Chart: TradingView.com

Data indicates significant selling pressure on Polygon notwithstanding the recent price increase. The notable rise in the exchange inflow suggests investors shifting tokens onto exchanges—often a prelude to selling. MATIC’s supply on exchanges supports this tendency even more since supply kept outside of exchanges has dropped.
Technical Indicators Paint A Mixed Picture
Other technical indicators remain bearish even if the MACD presents some hope. Reduced volatility shown by the Bollinger Bands can indicate either a further price decline or consolidation prior to a breakout. Both the Money Flow Index (MFI) and Chaikin Money Flow (CMF) have shown downfalls, maybe indicating the end of the brief bull surge.
Polygon’s Path Forward
Though Polygon’s technical future is yet unknown, a total reversal is not unthinkable. MATIC might rise in response to ongoing good changes in the Polygon ecology as well as more general market recovery.
Still, a consistent bull run depends on overcoming technical resistance and selling pressure levels. Before deciding what to invest in, investors should use prudence and attentively track changes in the market.
Featured image from Pexels, chart from TradingView