Reason to trust

How Our News is Made
Strict editorial policy that focuses on accuracy, relevance, and impartiality
Ad discliamer
Morbi pretium leo et nisl aliquam mollis. Quisque arcu lorem, ultricies quis pellentesque nec, ullamcorper eu odio.
Polkadot (DOT) price shows that the coin has finally latched on to its support zone.
- Polkadot price analysis looks extremely bearish
- DOT/USD resistance at $7.79
- DOT/USD support at $7.05
The bulls did a clap back and were able to rebound as DOT dodged further downtrend that falls below $7.22 and instead went for a range upwards or shooting towards $7.42.
ADA showed some recovery but provided the necessary support for the coin’s price. With the prevailing intense selling pressure in the market, a downtrend was apparent for ADA that has been lingering for more than a week now.
According to CoinMarketCap, the DOT price has swerved down again as it dropped by 3.65% or is trading at $7.14. Evidently, the coin has corrected and had dipped lower at it was priced at $7.34 a few hours ago.
Polkadot Bears Smacked the Bulls
From a 24-hour perspective, Polkadot’s price reveals the presence of intense selling pressure that has resurfaced due to the reduction in coin price.
The bears were also able to smack the bulls that were acing it yesterday as increased selling pressure has been noted today.
With the bears pummeling the price downward, DOT price slumped to $7.34 which sets the next support at $7.05.
The coin is said to have gained 1.15% profit overnight due to the coin’s bullish streak yesterday. On the other hand, DOT lost around 19.76% in the past few days due to intense selling activity.
MA level for DOT has also dropped which is now spotted at the $8.04 zone after it has dived below the SMA 50 curve.
As DOT price has been cascading down for the past few days, the Bollinger bands have also expanded, showing a spike in volatility with both limits skewing. The upper band is now seen at $9.96 with the lower band spotted at $7.05 showing support for Polkadot.
RSI for DOT has retraced to index 39 following the bearish sprint.

Chart from TradingView.com
DOT RSI Shows Increased Buying Pressure
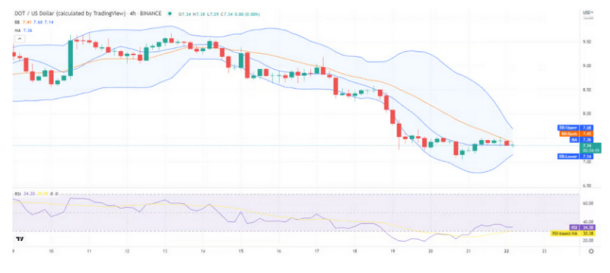
On the 4-hour price chart, DOT price is looking bearish and the momentum going downwards today. DOT price is spiking again as the range now forms the support zone for the coin. However, the plunge seen at the beginning of the trading session has propped the bearish trend for the crypto market. MA value for DOT is spotted at the price zone of $7.36.
The coin’s volatility is also softened with the Bollinger bands demonstrating a sharp convergence. Evidently, the upper band clutched on the $7.68 resistance level, while the lower band inched closer to the $7.14 level. The RSI curve is seen to have evened out at index 34 with the increase in buying pressure as in the past four hours.
Crypto total market cap at $985 billion on the daily chart | Source: TradingView.com

Featured image from Coincu News, Chart from TradingView.com


