Reason to trust

How Our News is Made
Strict editorial policy that focuses on accuracy, relevance, and impartiality
Ad discliamer
Morbi pretium leo et nisl aliquam mollis. Quisque arcu lorem, ultricies quis pellentesque nec, ullamcorper eu odio.
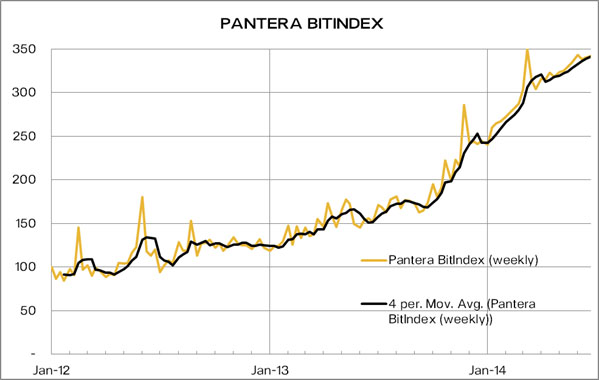
Pantera Capital’s interest in bitcoin has been growing immensely over the past year (that is their business, after all). So much so, in fact, the company has announced the launch of a little something they are calling the “Bitindex”.
News of this Bitindex came in the form of a newsletter sent out to investors recently, in which the company suggested the index would be of use for medium-term forecasting of bitcoin movements. But that’s not to say its a measure or forecast of the bitcoin price:
Pantera has developed the BitIndex to inform our views on bitcoin. It is not a tool to forecast bitcoin’s price. This index is designed to assist us in forming our views on what may happen to bitcoin in the medium term.

Said Bitindex takes measure of seven data points. They are: developer interest on Github; Merchant adoption; Wikipedia views; network hashrate; Google searches; user adoption measured by wallets; and transaction volume.
Certainly, the Bitindex won’t be of much use to everybody. Many enthusiasts and investors alike simply prefer easily-accessible price charts already available on the web. And with blended indexes like the Winklevosses’ WinkDex, price-watchers are easily able to get an average.
Pantera Capital not only invests directly in bitcoin, but also funds start-ups that operate in the space.
[textmarker color=”C24000″]Source[/textmarker] CoinDesk, Digital Currency Magnates


Get FREE Bitcoin here @ http://freebitco.in/?r=455497
the y-axis on the chart is a dimensionless number; only its relative scale is meaningful.
The last 6 months of the chart are very interesting. Both when the price bounced down from ~$1100 to $800 and with the further bounce down into the $300s in April and May, this index hardly blipped to the downside. That’s a big change from further back in time on the chart, especially the 2012 section where the dips are very distinct and last much longer.
Nice chart. Good story. I’m trying to stay here and away from the uh, other place.