Reason to trust

How Our News is Made
Strict editorial policy that focuses on accuracy, relevance, and impartiality
Ad discliamer
Morbi pretium leo et nisl aliquam mollis. Quisque arcu lorem, ultricies quis pellentesque nec, ullamcorper eu odio.
MATIC, the native token to Polygon is up more than 6% intraday, but could be on the cusp of much more, according to a handful of technical signals.
The last time these five buy signals appeared, MATIC went on an incredible, 10,000% rally in a matter of only four months. Could these same conditions be foretelling of yet another explosive breakout?
Five Bullish MATIC Technical Signals
The recent rally in MATIC has moved the cryptocurrency past Dogecoin and into the number 9 rank by market capitalization. But the upside in the token might only be beginning.
Polygon is preparing to launch its zero-knowledge Ethereum Virtual Machine (zkEVM) beta mainnet on March 27 and has been tapped by major companies Meta, Disney, Adidas and Starbucks, giving it plenty of fundamental value.
From a purely technical perspective, MATIC could be ready to pop. Five potential bullish signals are triggering or close to it, that in the past when combined led to a 10,000% price increase.
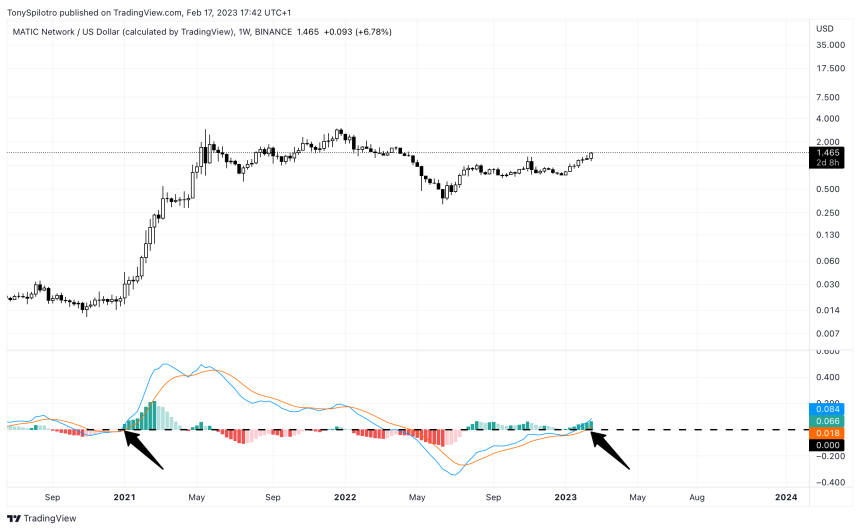
Momentum is increasing and flipped bullish | MATICUSD on TradingView.com
LMACD
It’s no surprise given the positive narrative in Polygon that the MATIC token is gaining momentum. That increase in momentum can be seen in the weekly Logarithmic Moving Average Convergence Divergence indicator, otherwise known as the LMACD.
The tool is crossing above the zero line on an already green histogram, while the MACD line has passed through the signal line from below.
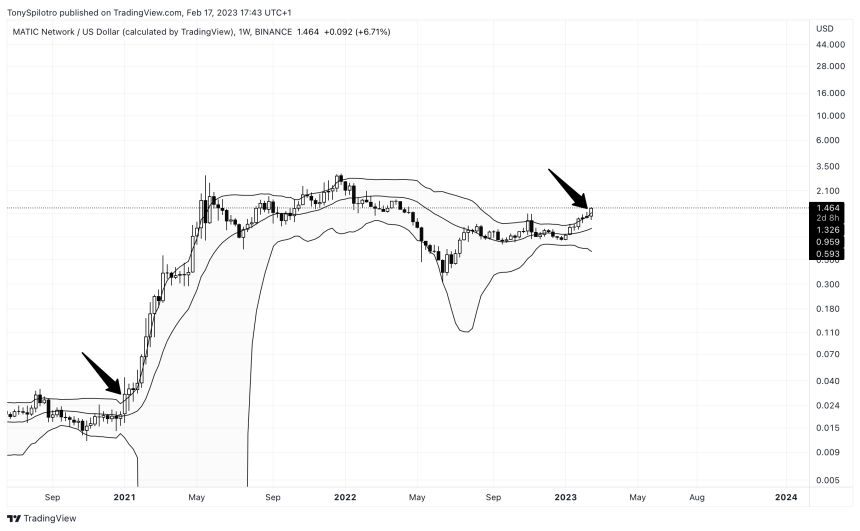
Will Polygon ride the Bollinger Bands? | MATICUSD on TradingView.com
Bollinger Bands
If MATIC can maintain current price levels or higher on the one-week timeframe, the token will have closed outside of the weekly Bollinger Bands. A close outside of the upper band is a buy signal and can suggest strong continuation if the bands begin to expand and price rides the upper band higher.
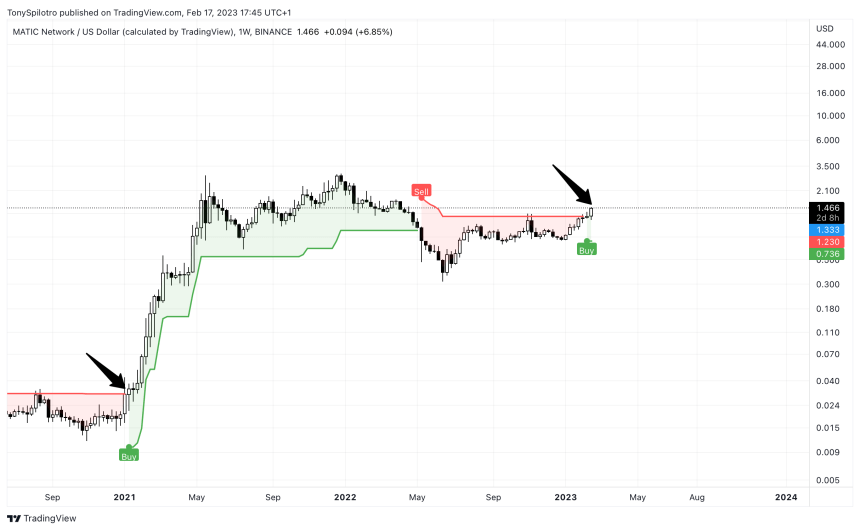
A confirmed buy signal from the SuperTrend | MATICUSD on TradingView.com
SuperTrend
At the very same level as the upper Bollinger Band, the SuperTrend has been tapped, triggering a buy signal. The signal actually appeared last week, and has since been confirmed.
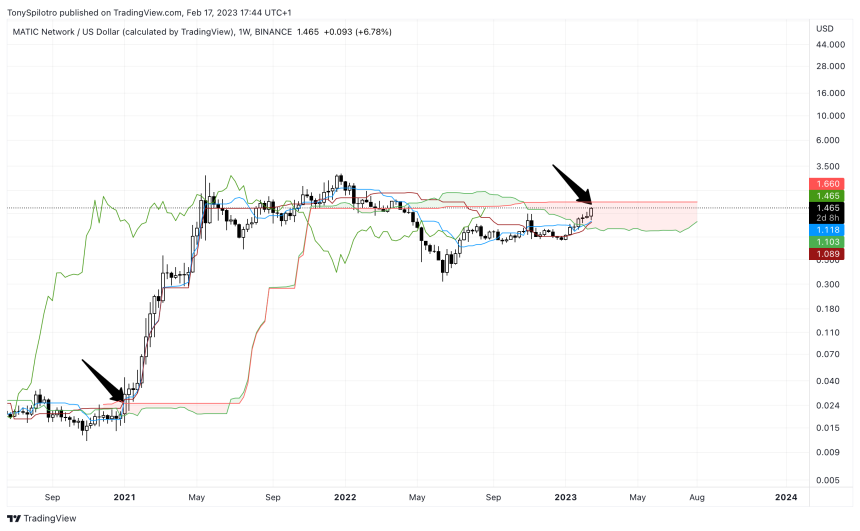
Making it out of the cloud is critical for continuation | MATICUSD on TradingView.com
Ichimoku
Continuing to highlight the important confluence of indicator resistance potentially being broken at this very moment, MATICUSD 1W has pushed into the Ichimoku cloud and is nearly at the top of it. Once outside the cloud, it’s clear skies for higher prices.
The Tenkan-sen and Kijun-sen are also crossed bullish and price is above the two lines, which are rising to show a trending market. Very little Chikou span resistance is located above this level.
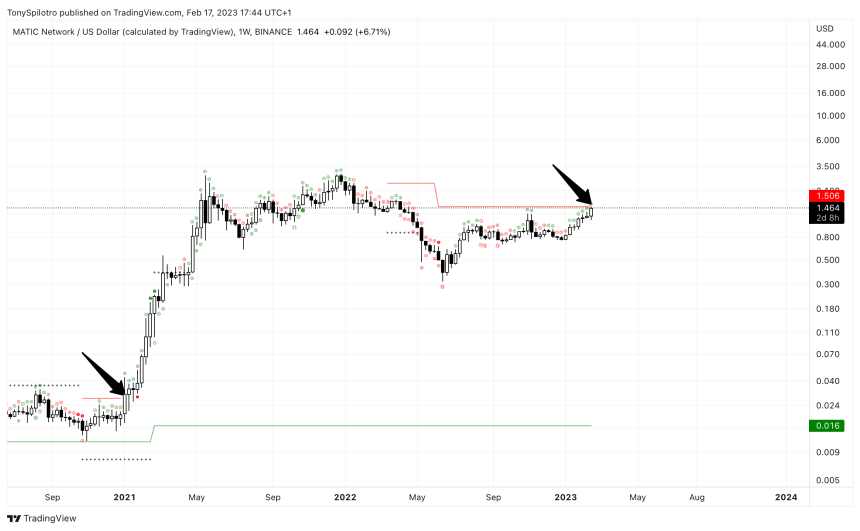
The red line is possibly the only resistance left | MATICUSD on TradingView.com
TD Sequential
Last but not least brings timing into play, with MATIC about to face off against TDST downtrend resistance, indicated by the red line created by the TD Sequential indicator. The token hasn’t made it through quite yet, but adds to the stacking signals appearing on the same weekly timeframe.
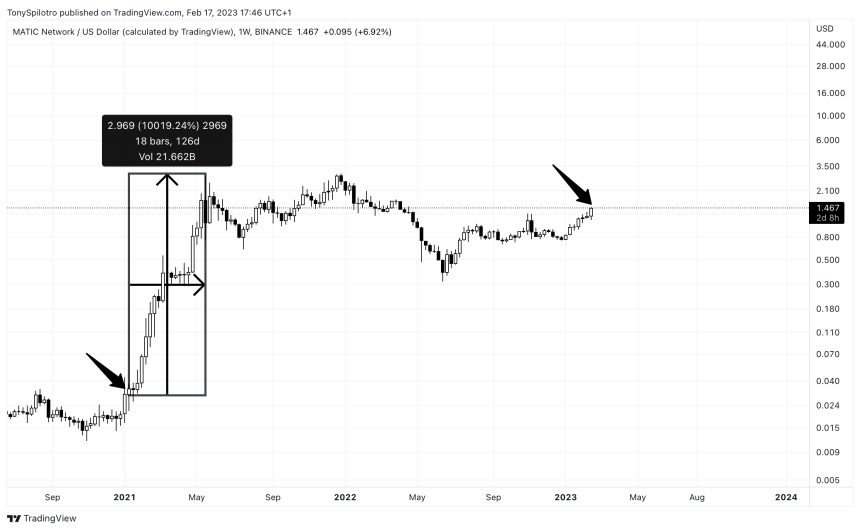
The last time these signals all appeared the token grew 10,000% | MATICUSD on TradingView.com
Another 10,000% Rally?
The last time all of these signals appeared simultaneously, MATICUSD climbed by 10,000% in only four months. Another 100x would take the cryptocurrency to over $140 a token. While another rally of that size is unlikely, a promising uptrend could be nearing a breakout. Considering the confluence of resistance at this level, failure would also be catastrophic and crush confidence further in the token.


