Reason to trust

How Our News is Made
Strict editorial policy that focuses on accuracy, relevance, and impartiality
Ad discliamer
Morbi pretium leo et nisl aliquam mollis. Quisque arcu lorem, ultricies quis pellentesque nec, ullamcorper eu odio.
Normally, in our bitcoin price watch pieces, we publish the levels that we will be watching throughout the day in terms of our in term support and in term resistance levels, with the intention that our readers can use these levels to dictate their intraday trading in the bitcoin price during whatever session the article covers. However, in today’s piece, and primarily as a result of what’s happening in Greece, we are going to do something little different. Action this morning has already produced some interesting volatility, and we have just broken through a level that we have been watching overnight. In light of this, instead of looking at the standard support and resistance, we are going to publish a live breakout piece, and suggest a trade entry on current action.
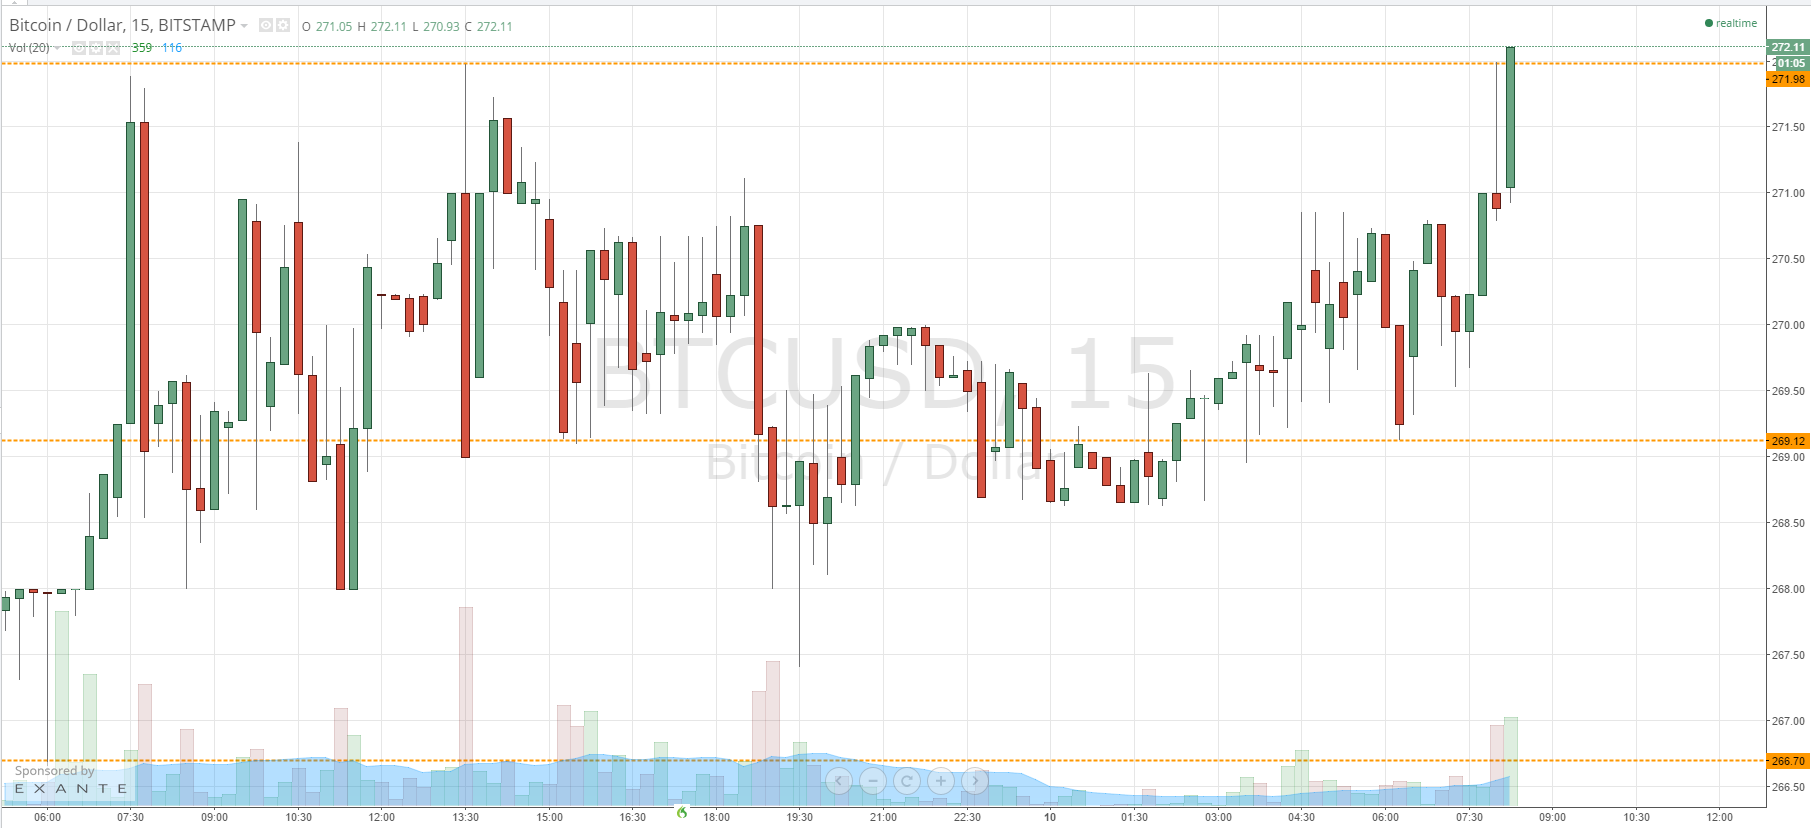
Take a quick look at the chart.
As you see, we have just broken above the level that had been watching as in term resistance overnight at 271.98. This has initiated a long trade towards an initial upside target of 277 flat. Assuming, of course, that we close above this level on the 15 minute intraday chart. If we can get this close, we will look towards the aforementioned target, with a stop loss somewhere around 271 flat helping us to maintain a positive risk to reward profile on the trade.
If we do return to trade within range, then we will bring more traditional in term support into play at 269.12. We can enter in the aggressive short trade towards this level on a failed test of resistance, with a stop loss somewhere around 273 making the trade attractive from a risk management perspective. If we break below 269.12, it would validate 265 flat medium-term, and stop loss around 270 flat on this trade will – once again – keep the trade attractive and ensure we are taken out of it in the event that we get a bias reversal and returned to trade within the range intraday.
Charts courtesy of Trading view


