
Reason to trust
How Our News is Made
Strict editorial policy that focuses on accuracy, relevance, and impartiality
Ad discliamer
Morbi pretium leo et nisl aliquam mollis. Quisque arcu lorem, ultricies quis pellentesque nec, ullamcorper eu odio.
Litecoin price is gaining pace above $90 against the US Dollar. LTC could rally further above $100 and rise toward the $110 resistance.
- Litecoin is steadily moving higher toward $100 against the US Dollar.
- The price is now trading above $90 and the 100 simple moving average (4 hours).
- There was a break above a key bearish trend line with resistance near $86.20 on the 4-hour chart of the LTC/USD pair (data feed from Kraken).
- The price could rally further toward the $100 and $110 levels.
Litecoin Price Regains Strength
After forming a base above the $80 level, Litecoin’s price started a fresh increase against the US Dollar. LTC price broke the $85 resistance to start the current rally.
There was a break above a key bearish trend line with resistance near $86.20 on the 4-hour chart of the LTC/USD pair. The pair rallied over 10% and outperformed both Bitcoin and Ethereum. It even climbed above the $92 level. A high is formed near $95.85 and the price is now consolidating gains above the 23.6% Fib retracement level of the upward move from the $81.70 swing low to the $95.85 high.
Litecoin is now trading above $90 and the 100 simple moving average (4 hours). On the upside, immediate resistance is near the $96 zone. The next major resistance is near the $100 level. If there is a clear break above the $100 resistance, the price could start another strong increase.
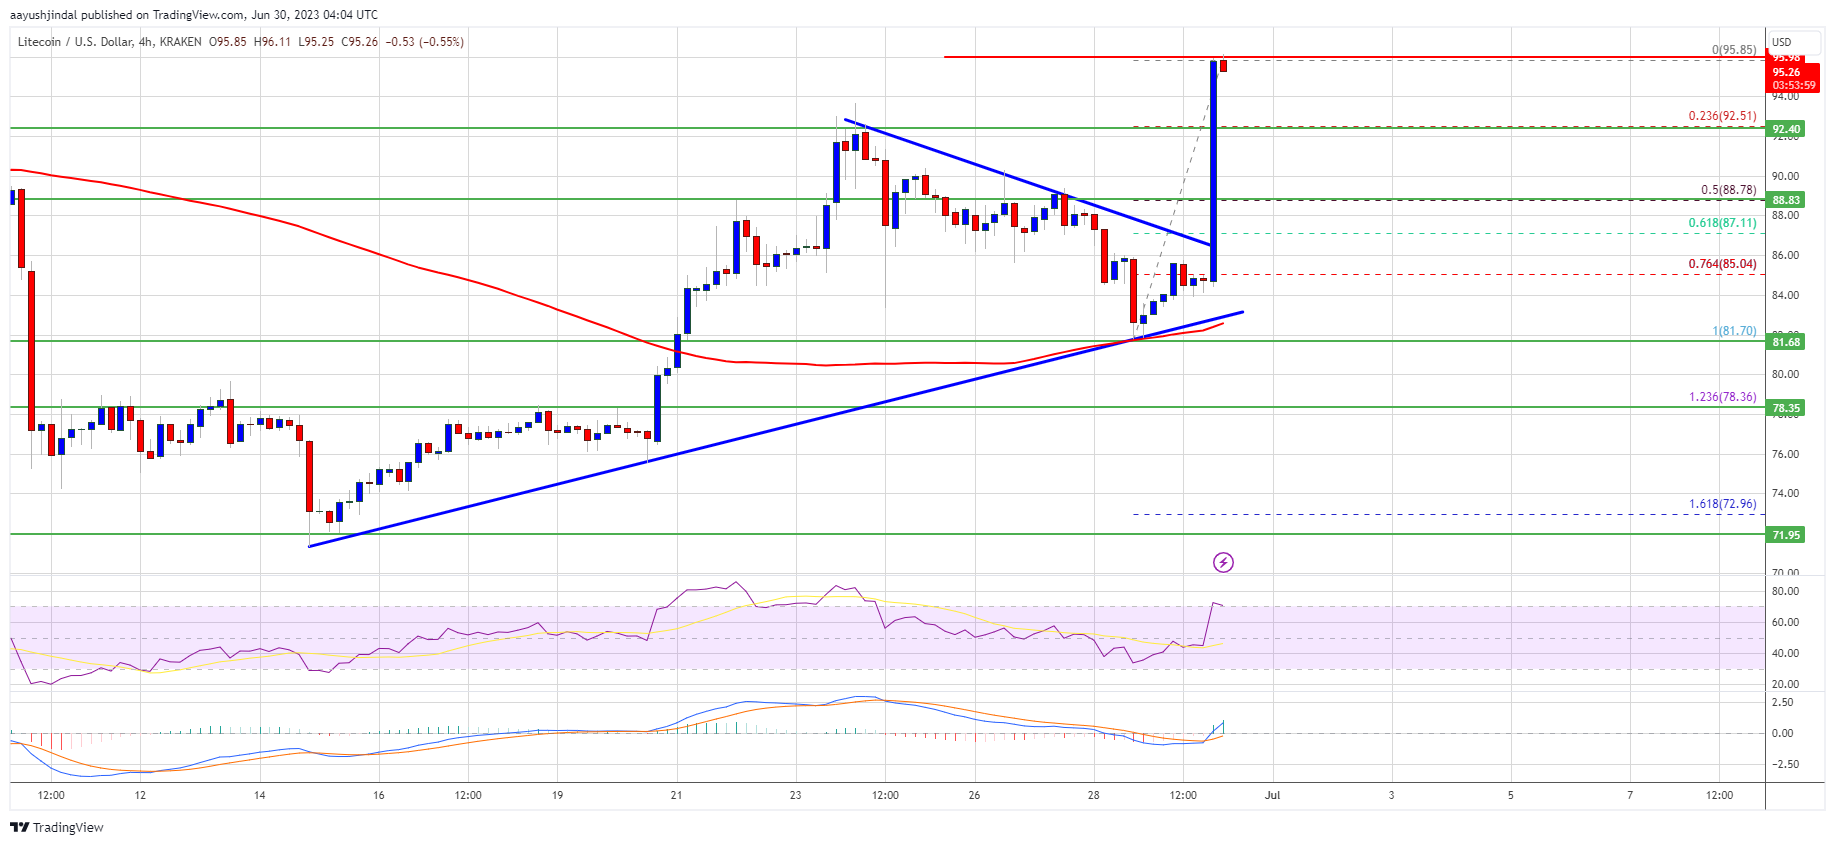
Source: LTCUSD on TradingView.com
In the stated case, the price is likely to continue higher toward the $108 and $110 levels. Any more gains might send LTC’s price toward the $120 resistance zone.
Are Dips Limited in LTC?
If Litecoin price fails to clear the $100 resistance level, there could be a downside correction. Initial support on the downside is near the $92 level.
The next major support is forming near the $88.50 level or the 50% Fib retracement level of the upward move from the $81.70 swing low to the $95.85 high, below which there is a risk of a move toward the $85.00 support. Any further losses may perhaps send the price toward the $82 support.
Technical indicators:
4-hour MACD – The MACD is now gaining pace in the bullish zone.
4-hour RSI (Relative Strength Index) – The RSI for LTC/USD is above the 50 level.
Major Support Levels – $92.50 followed by $88.50.
Major Resistance Levels – $96.00 and $100.00.


