Reason to trust

How Our News is Made
Strict editorial policy that focuses on accuracy, relevance, and impartiality
Ad discliamer
Morbi pretium leo et nisl aliquam mollis. Quisque arcu lorem, ultricies quis pellentesque nec, ullamcorper eu odio.
Just yesterday I discussed the possibility of a major breakout in Litecoin along with a price target of $1.60. The breakout did happen, and the price touched a low of $1.63 before stabilizing around $1.66.
The collapse in Litecoin price happened in concurrence with the 8% crash in Bitcoin price, and with expectations of Bitcoin touching $230 rising, Litecoin may witness a more pronounced fall in the coming sessions.
Image: https://www.tradingview.com/x/ovU4bd9a/
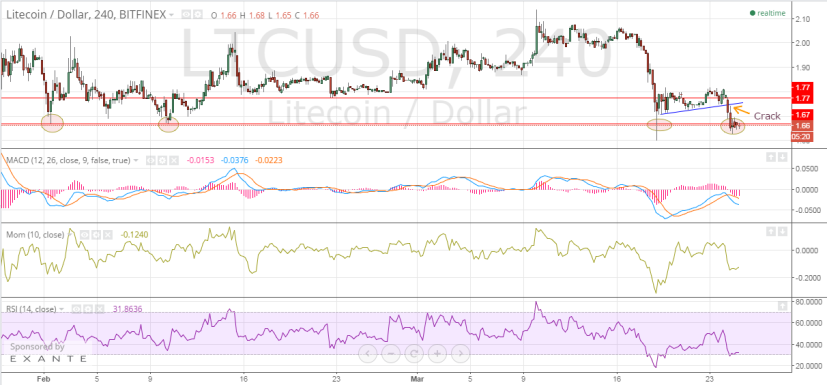
Analyzed above is the 240-minute LTC/USD price chart covering the period from late January to date.
Chart Structure – Litecoin has broken below the support trendline (marked as blue in the chart above) and has taken support from the medium-term support level of $1.66. As can be seen, the level of $1.66 has been respected by the market on 3 occasions since February. If the bulls cave in to the selling pressure and the support is breached, extremely deep downsides may open up.
Moving Average Convergence Divergence – The MACD, the Signal Line, and the Histogram value have turned negative following the debacle. The latest readings of MACD, Signal Line, and Histogram are -0.0376, -0.0223, and -0.0153, respectively. With momentum indicator turning negative, Litecoin price may remain under pressure for some more time.
Momentum – The Momentum indicator has experienced collateral damage. The reading has slumped to -0.1240 in conjunction with the panic selling.
Relative Strength Index – Bulls have barely managed to keep the RSI value above the oversold territory, which is evident from the latest reading of 31.8636.
Bitcoin, being the leading cryptocurrency, has always had a bold effect on the price action of Litecoin. However, it remains to be seen whether a further decline in Bitcoin will be sufficient to force Litecoin below the crucial support level of $1.66. Short-term traders are advised to sell on rallies. Shorting at current levels should be avoided as the altcoin may jump in the near term.


