At the start of the April 2nd session, we noted that litecoin was showing some initial signs of reversal when it failed to reach down to the 1.60/1.61, March low. As we get started with the April 3rd session, we are seeing some initial signs of the anticipated bullish reversal, at least for the short-term.
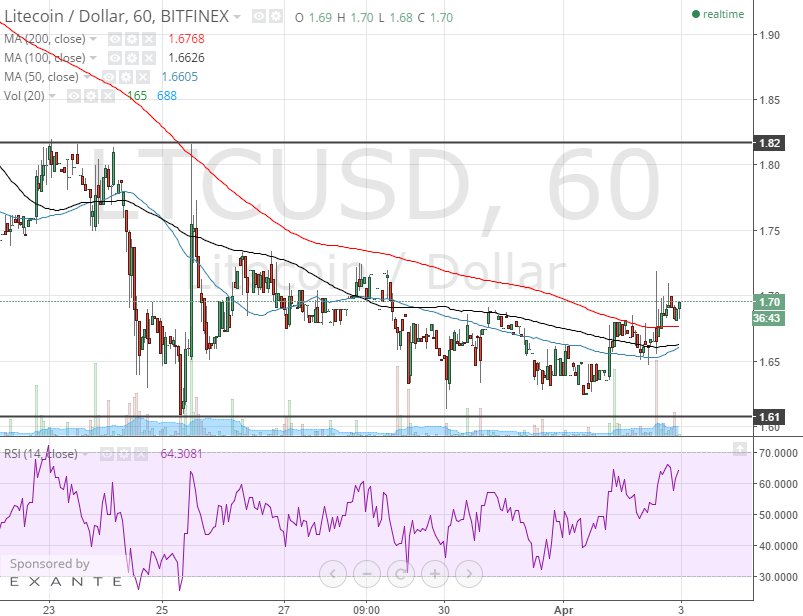
Litecoin (LTCUSD) 1H Chart April 3rd, 2015
(click to enlarge)
In the 1H chart ,we can see that price spiked up during early part of the April 2nd session, pushing to 1.72 before stalling. This took ltcusd above the cluster of 200-, 100-, and 50-hour SMAs. We also saw the 1H RSI break above 60, showing loss of the prevailing bearish momentum. As we begin the April 3rd session, we can see that price is still above the moving avearges, and looks to “chew” up the tail from the bullish spike. If ltcusd does climb up above 1.72, then the 1.82 handle should remain in play. Failure to push above 1.72 and a fall below 1.65 during the April 3rd session would invalidate the bullish outlook, and put pressure on the 1.61 low.
A break below 1.60 would essentially open up the 1.10 low on the year. But let’s stick with the bullish outlook first and look at the 4H chart for the price action since March.
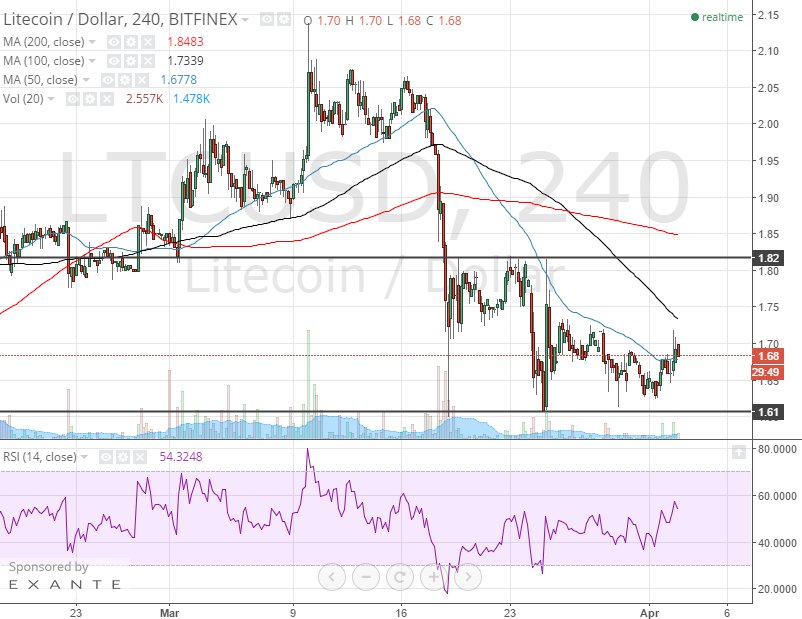
Litecoin (LTCUSD) 4H Chart April 3rd, 2015
(click to enlarge)
We can see that March was initially bullish until litecoin reached 2.10. After some consolidation above 2.00, the pair retreated sharply down to 1.61. It is showing signs of bottoming now but there are a few things we should see first before being confidence about the bullish reversal scenario.
1) The 4H RSI should break above 60, which would show loss of the prevailing bearish momentum. A push to 70 would introduce bullish momentum in the 4H chart.
2) Price should push above 1.75 and start holding above 1.70. Technically, a break above 1.82 would be needed to complete a price bottom. But there are some clues we can pick up from the near-term.
Now, if the bulls do indeed take back the market, and ltcusd pushes above 1.82, we should first look at 2.00 as resistance, but with risk of extending to the common highs just under 2.10.
If price can clear above 2.15, the 2.74 high on the year will come into play as well.
Previous Post by Author: Litecoin Price Technical Analysis for 2/4/2015 – Reversal Attempt