Reason to trust

How Our News is Made
Strict editorial policy that focuses on accuracy, relevance, and impartiality
Ad discliamer
Morbi pretium leo et nisl aliquam mollis. Quisque arcu lorem, ultricies quis pellentesque nec, ullamcorper eu odio.
Litecoin price increased a bit during yesterday’s trading sessions to record a high of $1.86 and a low of $1.83. It seems that the price will continue to rise; especially that bitcoin price is rising as well.
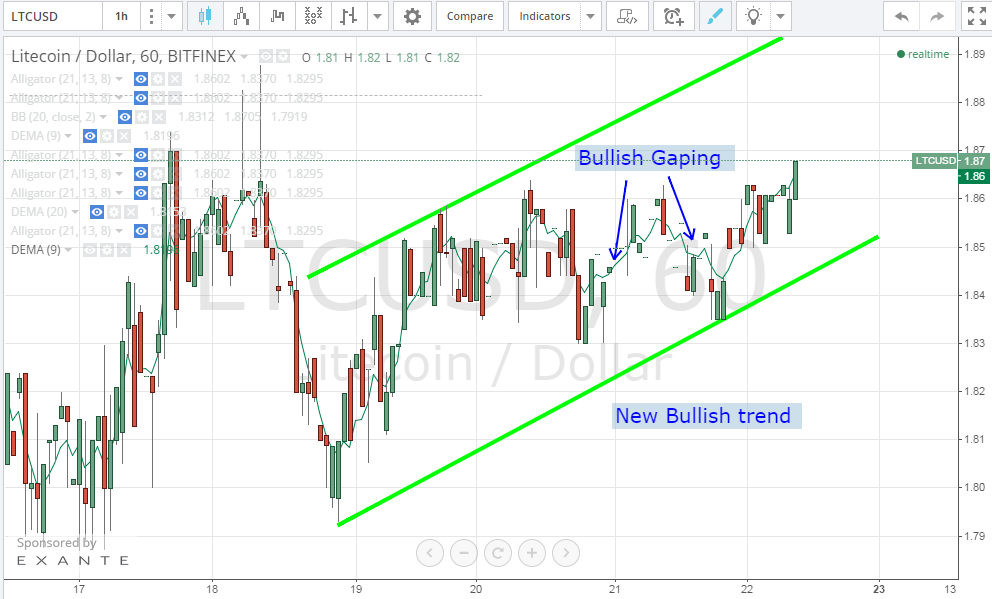
By studying the 1 hour Bitfinex (LTC/USD) charts from tradingview.com and plotting the 20 hour EMA accordingly (look at the below chat), we can conclude the following:
- We can now spot a new uptrend line that has started on the 18th of February as shown by the two green trend lines on the below chart. Litecoin price is pushing upwards slowly and the support level has also been rising during the past 4 days.
- At the time of writing of this article, litecoin was trading at $1.87 which is higher than yesterday’s high and proves that the new bullish wave is continuing to control the market.
- The price is now above the 20 hour EMA which is in favor of continuation of the bullish wave. If the price continues to be above the 20 hour EMA curve, we can see it testing the $2.00 resistance level soon.
- We can notice “bullish gaping” on the 1 hour charts on the 20th and 21st of February, which denotes that the market’s buying power is strong and can push the price up to the $2.00 resistance level within 48 hours or so.
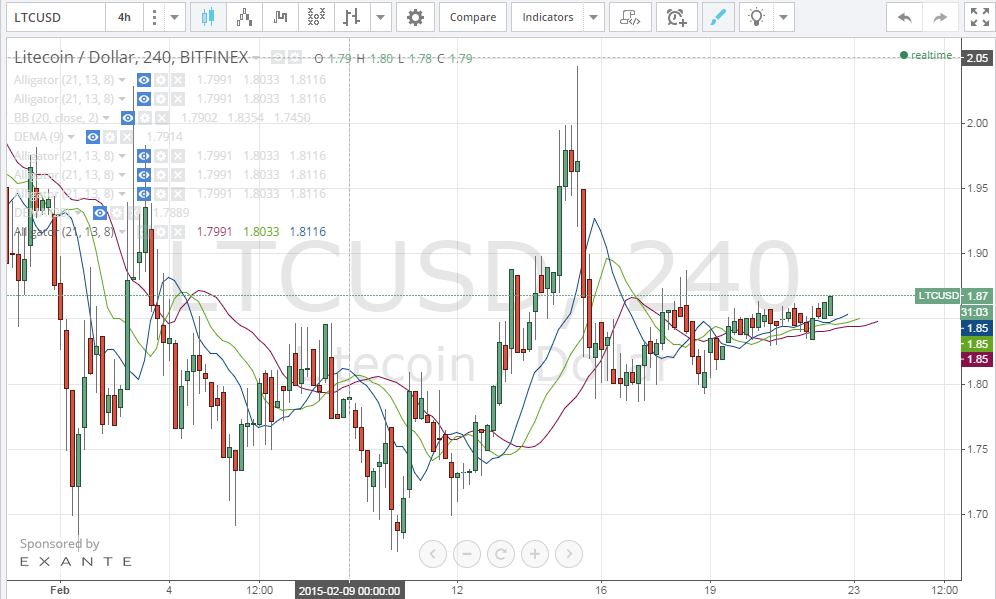
By studying the 4 hour Bitfinex (LTC/USD) charts from tradingview.com and plotting the William’s Alligator indicator accordingly (look at the below chart), we can notice the following:
- The bullish attempt on the 16th of January failed to take the price above $1.89. During that bullish attempt, the alignment of the moving averages of the William’s Alligator indicator wasn’t perfect for a strong bullish rally.
- We have to see the alignment of the moving averages of the William’s Alligator indicator change before a strong bullish wave is noticeable.
Conclusion:
Litecoin price is advancing slowly to the north. Our technical analysis is in favor of a bullish rally that pushes the price up to $2.00 within the next 48 hours.


can you stop talking about january when you mean february:)