
Reason to trust
How Our News is Made
Strict editorial policy that focuses on accuracy, relevance, and impartiality
Ad discliamer
Morbi pretium leo et nisl aliquam mollis. Quisque arcu lorem, ultricies quis pellentesque nec, ullamcorper eu odio.
Starting from today, I will be posting a daily litecoin price technical analysis, so I guess it’s better to establish key resistance and support levels that will be a base for our future analyses during the upcoming couple of weeks.
Litecoin price increased to score a high of $2.04 yesterday, before dropping to a low of $1.79. By examining the 1 hour (LTC/USD) and (BTC/USD) charts, we can clearly see that litecoin price is mirroring what is happening on the bitcoin charts.
By studying the 1 day Bitfinex (LTC/USD) chart from tradingview.com and plotting the Fibonacci retracement fan along a trend line that extends between the high reached on the 13th of November ($4.36) and the low reached on the 14th of January ($1.09) (look at the below chart), we can better evaluate resistance and support levels. The price is now trading at a price below the 20 day EMA. Litecoin price is now touching the 50% Fibonacci resistance fan level, so if it increases above 1.85, we can see it increase to $2.00 within about 24 hours. According to the Fibonacci retracements we plotted, we can notice that the next resistance level will be at $2.35 which coincides with the 62% retracement level.

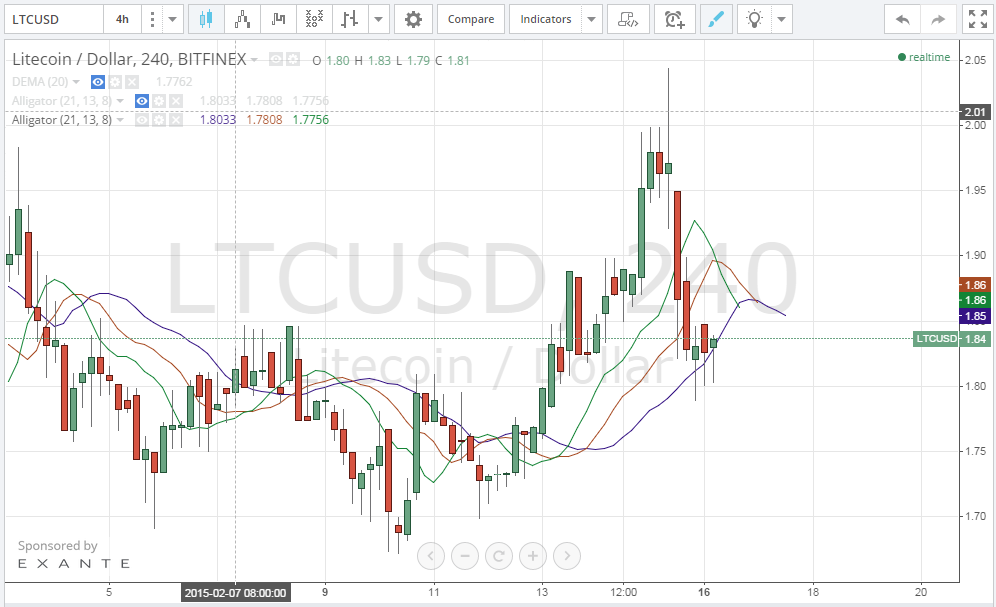
By studying the litceoin 4 hour Bitfinex (BTC/USD) charts from tradingview.com and plotting the William’s Alligator indicator accordingly, we can see that the litecoin price is facing support at around $1.9 which is expected to prevent a further drop. William’s Alligator alignment of moving averages is not in favor of a reverse in the downtrend, so we expect to see a different alignment of these moving averages before an uptrend can be noticeable.
Conclusion:
Today’s litecoin price drop seems to be ignited by the decline in bitcoin price. It seems that we will have to wait for at least 24 hours before we can see a reverse in this downtrend.
Charts from Bitfinex


Hammer Pattern at the end seems to indicate possible bullish trend for 17th Feb 2015.