

Often labelled “silver to Bitcoin’s gold,” Litecoin (LTC) has left investors wondering this week. Following a little surge, LTC finds itself caught in a price tug-of- war with analysts split on whether it will rise to $90 or revert to its support level close to $80.
Mixed Signals Cloud Litecoin’s Future
For LTC last week‘s price action was a sluggish, wobbly increase followed by a dismal stall, not the kind that gets investors shouting with delight. LTC broke the $80 barrier on May 15th, but its impetus faded and it hung about $83.81 at press time.
Not mincing words is popular crypto analyst CRYPTOWZRD. Their most recent tweet presents a picture of uncertainty, LTC caught in a pricing range between $80 and $94. Though the direction is still unknown, a breakout—either bullish or bearish—seemingly is about to happen.
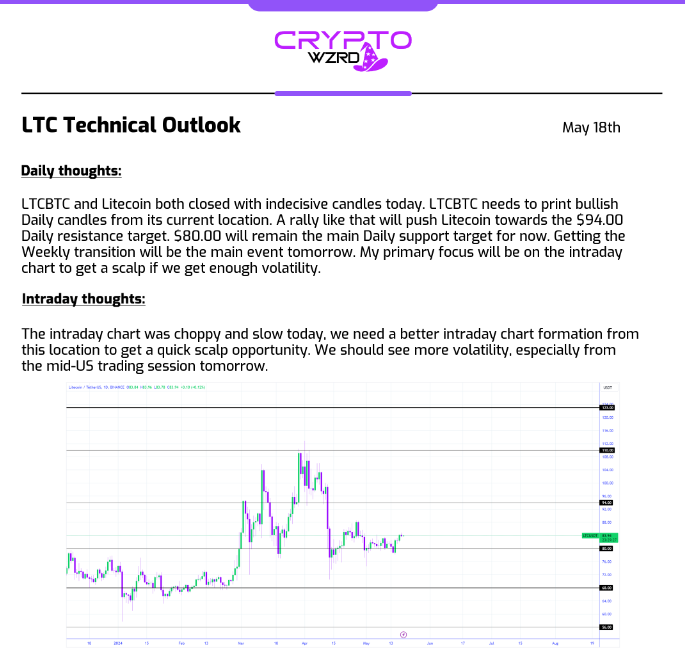
LTC Daily Technical Outlook:$LTC closed indecisively today and it is trading in the middle of a Daily range area. I will pay more attention to the intraday chart development tomorrow to get a quick scalp 👀 pic.twitter.com/T5hAFTndIu
— CRYPTOWZRD (@cryptoWZRD_) May 19, 2024
Analyses are looking to on-chain data, the digital footprints left behind by bitcoin transactions, to predict LTC’s next movement. Here too, the picture is far from clear.

Undervaluation measured by Glassnode’s NVT ratio—which flashes red—suggests a possible price fall. Still, a low reserve risk indicator suggests a forthcoming increase in optimistic attitude. Often a positive sign, whale activity is still high; meanwhile, the MVRV ratio—which evaluates long-term investors’ profitability—has also started to climb.
Litecoin: Technical Indicators Offer Tentative Hope
Technical indicators, meantime, give LTC bulls some hope. Comfortable above the neutral mark, the Relative Strength Index (RSI) indicates the coin is not overbought.

The volatility indicator the Bollinger Bands provide one dampener on the celebration spirit. LTC’s present place in the ranges points to a low volatility period, so a dramatic price increase is less likely.
This little volatility is noteworthy since bollinger bands usually tighten when market prices converge, indicating little directional movement. For LTC, this means the probability of a significant price breakout is reduced without an outside catalyst to propel momentum.
Crucial Levels: The $80-$85 Tightrope Walk
LTC must overcome a key resistance level at $85 if it is to attain its holy grail of $90. Given possible liquidations at that pricing point, this obstacle could be especially difficult.
On the down side, should LTC fall short at the $80 support level, a price decline to $78 could be in store.
Featured image from Pixabay, chart from TradingView