
Reason to trust
How Our News is Made
Strict editorial policy that focuses on accuracy, relevance, and impartiality
Ad discliamer
Morbi pretium leo et nisl aliquam mollis. Quisque arcu lorem, ultricies quis pellentesque nec, ullamcorper eu odio.
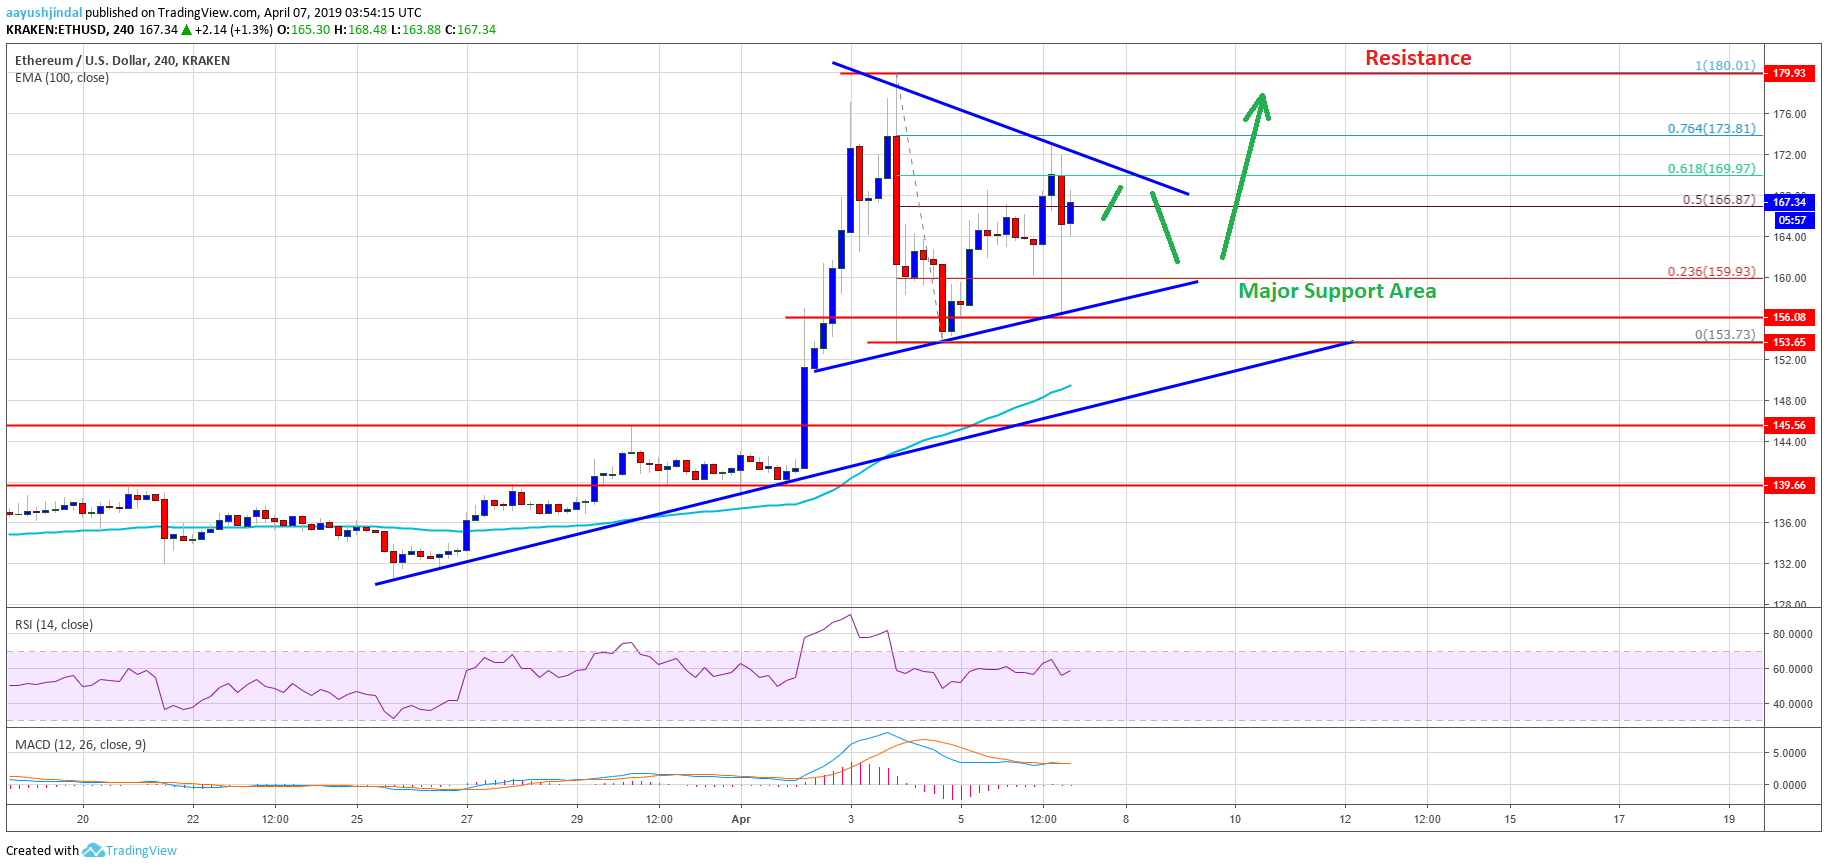
- ETH price started a nice uptrend above the $155 and $165 resistances against the US Dollar.
- The price traded as high as $180, corrected lower, and now preparing for the next upside break.
- There are two bullish trend lines in place with support near $159 and $153 on the 4-hours chart of ETH/USD (data feed via Kraken).
- The pair remains in a strong uptrend and it is likely to climb towards $180 and $200 in the near term.
Ethereum price is following a solid bullish path versus the US Dollar, but struggling against bitcoin. ETH is likely setting up for a fresh increase for $180 and $200, while BTC is already gaining momentum.
Ethereum Price Weekly Analysis
This past week, ETH price started a strong upward move after it broke the $140 and $145 resistances against the US Dollar. There was a nasty rise above the $155 resistance level and the 100 simple moving average (4-hours). Buyers gained control and pushed the price above the $165 and $170 resistance levels. The price traded to a new yearly high at $182 and later started a downside correction. There were a few swing moves, but finally a low and support was formed near the $154 level.
Ether price recovered recently and moved above the $165 level. There was a break above 50% Fib retracement level of the last correction from the $180 high to $154 swing low. However, the price seems to be facing a strong resistance near the $170 and $172 levels. Besides, the 61.8% Fib retracement level of the last correction from the $180 high to $154 swing low also acted as a hurdle for buyers. At the moment, there are two bullish trend lines in place with support near $159 and $153 on the 4-hours chart of ETH/USD.
More importantly, it seems like there is a breakout triangle in place with resistance near $170. A successful break above the triangle and $172 is likely to push the price higher. The next stop for buyers could be near the $180 swing high. Above $180, the main target is likely to be $200.
The above chart indicates that Ethereum is clearly trading with a positive tone above $155 and $160. Even if there is a downside correction, the price remains supported near $160 and $155. Only a daily close below the $152 level and the 100 simple moving average (4-hours) might increase selling pressure.
Technical Indicators
4 hours MACD – The MACD for ETH/USD is about to move back in the bullish zone.
4 hours RSI – The RSI for ETH/USD is currently positioned well above the 55 level.
Major Support Level – $160
Major Resistance Level – $180


