Reason to trust
How Our News is Made
Strict editorial policy that focuses on accuracy, relevance, and impartiality
Ad discliamer
Morbi pretium leo et nisl aliquam mollis. Quisque arcu lorem, ultricies quis pellentesque nec, ullamcorper eu odio.
Fetch.ai (FET) is at a critical crossroads as it tests a key bearish trendline. While the cryptocurrency has struggled against the trendline, signs of emerging bullish sentiment are fueling optimism for a potential breakout. As FET balances on this trendline, a strong move above it could open the door for a rally toward the $1.86 mark.
The aim of this analysis is to evaluate FET’s current price action as it hovers near a crucial bearish trendline. By examining key technical indicators and market sentiment, we seek to determine whether FET has the potential to break through resistance and ignite a rally toward the $1.86 level, or if the bears will continue to dominate, keeping the price subdued.
At the time of writing, FET was trading around $1.11, showing a 3.22% increase. FET boasts a market capitalization of over $2.8 billion and a trading volume of $116 million. In the past 24 hours, its market cap and trading volume have increased by 3.39% and 23.95%, respectively.
Analyzing FET’s Current Price Action
On the 4-hour chart, despite trading below the 100-day SMA, FET is showing promising momentum, attempting to move above the trendline. The appearance of multiple bullish candlesticks indicates strong buying interest and positive market sentiment, suggesting that a breakout could be imminent.
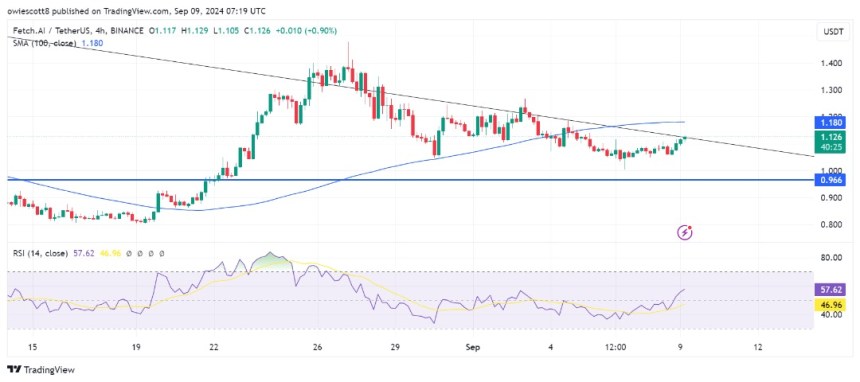
In addition, the Relative Strength Index (RSI) in the same timeframe has moved above the 50% mark and is currently at 56%. This rise indicates that bullish momentum is building, potentially signaling a forthcoming breakout above the bearish trendline.

Also, on the 1-day chart, FET is gaining upward momentum as it targets a breakout above the bearish trendline, aiming to reach the 100-day Simple Moving Average (SMA). This movement suggests a positive market sentiment, with buyers potentially driving the price higher if a breakout occurs.
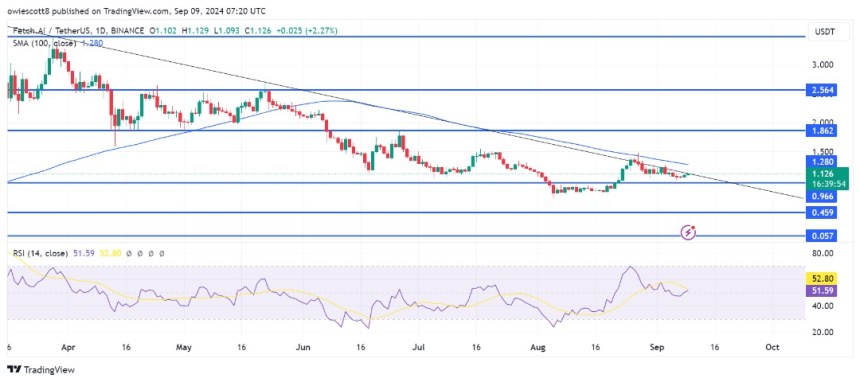
Finally, on the 1-day chart, the RSI signal has risen to 52% above the 50% threshold after briefly dropping to 47%. Particularly, this rebound suggests positive momentum is gaining strength, which could push the cryptocurrency higher.
FET Next Big Move – Rally Or Retreat?
With recent upward momentum and the RSI indicating optimistic signals, FET could be set for a substantial rally toward the $1.86 resistance level if it successfully breaks through the bearish trendline. A breach of this level might lead to further gains, possibly triggering the price to test the $2.56 resistance and even reach higher resistance zones.

If the trendline remains intact and bearish pressure continues, FET may face a decline toward the previous support level at $0.96. Furthermore, a break below this support could lead to an additional downtrend, potentially causing the price to fall to $0.45 or even lower.