
Reason to trust
How Our News is Made
Strict editorial policy that focuses on accuracy, relevance, and impartiality
Ad discliamer
Morbi pretium leo et nisl aliquam mollis. Quisque arcu lorem, ultricies quis pellentesque nec, ullamcorper eu odio.
Ethereum cleared the $405 and $410 resistance levels to start a fresh rally, following bitcoin price surge against the US Dollar. ETH price is likely to continue higher towards $450 and $465.
- Ethereum is up over 6% and it broke the key $420 resistance level.
- The price is now trading above $425 and the 100 hourly simple moving average.
- There is a major bullish trend line forming with support near $420 on the hourly chart of ETH/USD (data feed via Kraken).
- The pair could correct lower, but the $420 support zone is likely to protect losses.
Ethereum Price is Following Bitcoin’s Surge
After forming a support base above the $400 level, Ethereum started a strong upward move. ETH price broke the $405 and $410 resistance levels to move into a positive zone and start the recent rally.
The price gained bullish momentum and it surged above the $420 resistance level. The upward move was such that ether even spiked above $440 and it settled well above the 100 hourly simple moving average. A new monthly high is formed near $442 and the price is currently correcting lower.
Ether is trading below the $435 support, plus it traded below the 23.6% Fib retracement level of the recent rally from the $407 swing low to $442 high. On the downside, there are many supports, starting with $424.
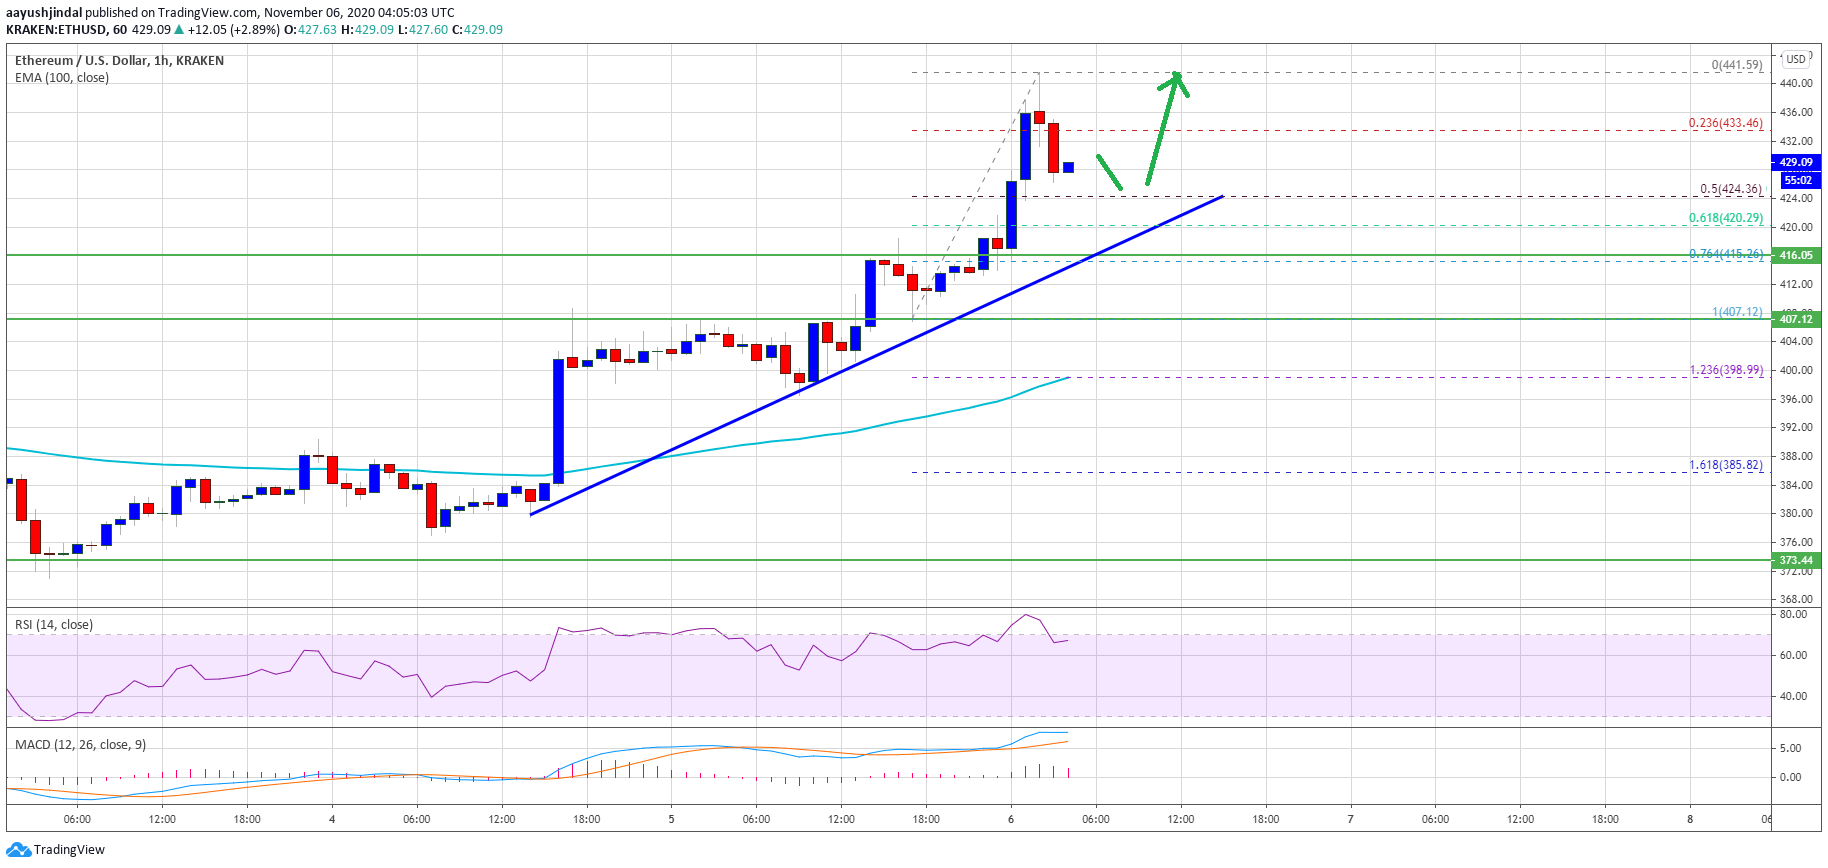
Source: ETHUSD on TradingView.com
The 50% Fib retracement level of the recent rally from the $407 swing low to $442 high is near $424 to provide support. There is also a major bullish trend line forming with support near $420 on the hourly chart of ETH/USD.
On the upside, the $435 level is an initial resistance. The first major hurdle is near $440, above which the price could easily test $450. Any further gains could lead the price towards the $465 resistance.
Downside Limited in ETH?
If Ethereum fails to clear the $435 and $440 resistance levels, it could correct lower. The first major support on the downside is near the $424 level.
The main breakdown support is forming near the trend line and $420. If ether price breaks the trend line support, it could continue to move down towards the $400 support zone or the 100 hourly simple moving average.
Technical Indicators
Hourly MACD – The MACD for ETH/USD is slowly losing momentum in the bullish zone.
Hourly RSI – The RSI for ETH/USD is still well above the 60 level.
Major Support Level – $420
Major Resistance Level – $440


