
Reason to trust
How Our News is Made
Strict editorial policy that focuses on accuracy, relevance, and impartiality
Ad discliamer
Morbi pretium leo et nisl aliquam mollis. Quisque arcu lorem, ultricies quis pellentesque nec, ullamcorper eu odio.
Ethereum price is showing bearish signs below the $1,840 zone against the US Dollar. ETH could drop further toward the $1,720 support zone.
- Ethereum is gaining bearish momentum below the $1,850 and $1,840 resistance levels.
- The price is trading below $1,830 and the 100-hourly Simple Moving Average.
- There is a connecting bearish trend line forming with resistance near $1,820 on the hourly chart of ETH/USD (data feed via Kraken).
- The pair could drop further if it stays below $1,850 in the coming days.
Ethereum Price Extends Losses
Ethereum’s price failed to recover above the $1,850 resistance zone. ETH remained in a bearish zone and extended its decline below the $1,820 level, similar to Bitcoin.
The bears were able to push the price below the $1,800 level. A low is formed near $1,778 and the price is now consolidating losses. There was a recovery wave above the $1,795 level. The price is now trading near the 23.6% Fib retracement level of the recent drop from the $1,853 swing high to the $1,778 low.
Ether is now trading below $1,830 and the 100-hourly Simple Moving Average. There is also a connecting bearish trend line forming with resistance near $1,820 on the hourly chart of ETH/USD.
On the upside, the price might face resistance near the $1,815 level or the trend line. It is close to the 50% Fib retracement level of the recent drop from the $1,853 swing high to the $1,778 low. The next resistance is near $1,830 or the 100-hourly Simple Moving Average.
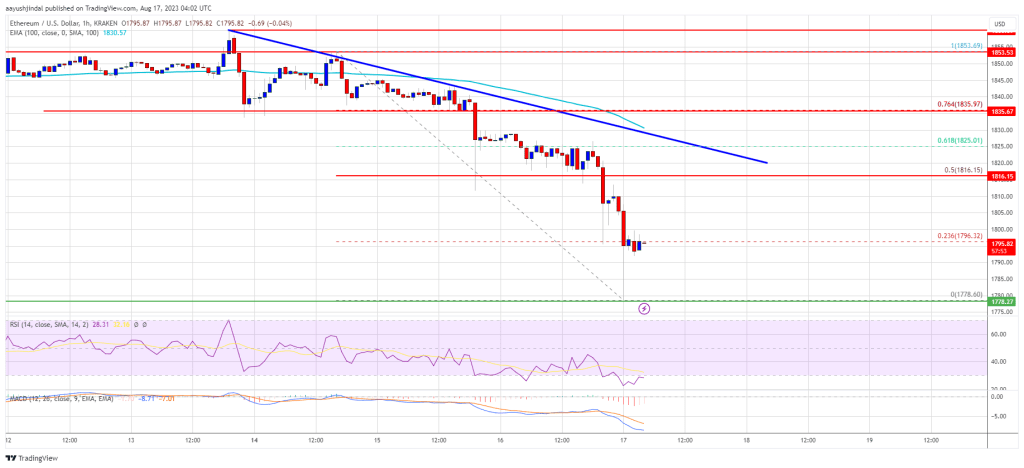
Source: ETHUSD on TradingView.com
The first key resistance is near the $1,835 level. The next key resistance is near the $1,850 level. A close above the $1,850 level could start a decent increase toward $1,880. Any more gains might send the price toward the $1,920 resistance, above which the price could rise toward the $2,000 zone.
More Losses in ETH?
If Ethereum fails to clear the $1,820 resistance, it could continue to move down. Initial support on the downside is near the $1,780 level.
The first major support is near the $1,750 zone. If the bulls fail to protect the $1,750 support, there could be more losses. The next major support is near the $1,720 support level. Any more losses might send the price toward the $1,650 level in the near term.
Technical Indicators
Hourly MACD – The MACD for ETH/USD is gaining momentum in the bearish zone.
Hourly RSI – The RSI for ETH/USD is now below the 50 level.
Major Support Level – $1,780
Major Resistance Level – $1,820


