
Reason to trust
How Our News is Made
Strict editorial policy that focuses on accuracy, relevance, and impartiality
Ad discliamer
Morbi pretium leo et nisl aliquam mollis. Quisque arcu lorem, ultricies quis pellentesque nec, ullamcorper eu odio.
Ethereum price corrected lower from the $1,875 zone against the US dollar. ETH retested the $1,780 zone and might soon attempt a fresh surge.
- Ethereum holds the key support at $1,780 and $1,750.
- The price is trading below $1,820 and the 100-hourly Simple Moving Average.
- There was a break above a steep bearish trend line with resistance near $1,795 on the hourly chart of ETH/USD (data feed via Kraken).
- The pair could start a fresh increase toward the $1,850 and $1,875 resistance levels.
Ethereum Price Revisits Uptrend Support
Ethereum attempted a fresh increase above the $1,850 resistance but upsides were limited, like Bitcoin. ETH traded as high as $1,874 and recently started a downside correction.
There was a move below the $1,850 and $1,820 levels. The price even spiked below the $1,800 level and the 100-hourly Simple Moving Average. It retested the $1,780 support zone. A low is formed near $1,777 and the price is now attempting another increase.
There was a break above a steep bearish trend line with resistance near $1,795 on the hourly chart of ETH/USD. Ethereum is now trading near the 23.6% Fib retracement level of the recent drop from the $1,874 swing high to the $1,777 low.
On the upside, the price is facing resistance near the $1,810 level and the 100-hourly Simple Moving Average. The first major resistance sits at $1,825 or the 50% Fib retracement level of the recent drop from the $1,874 swing high to the $1,777 low.
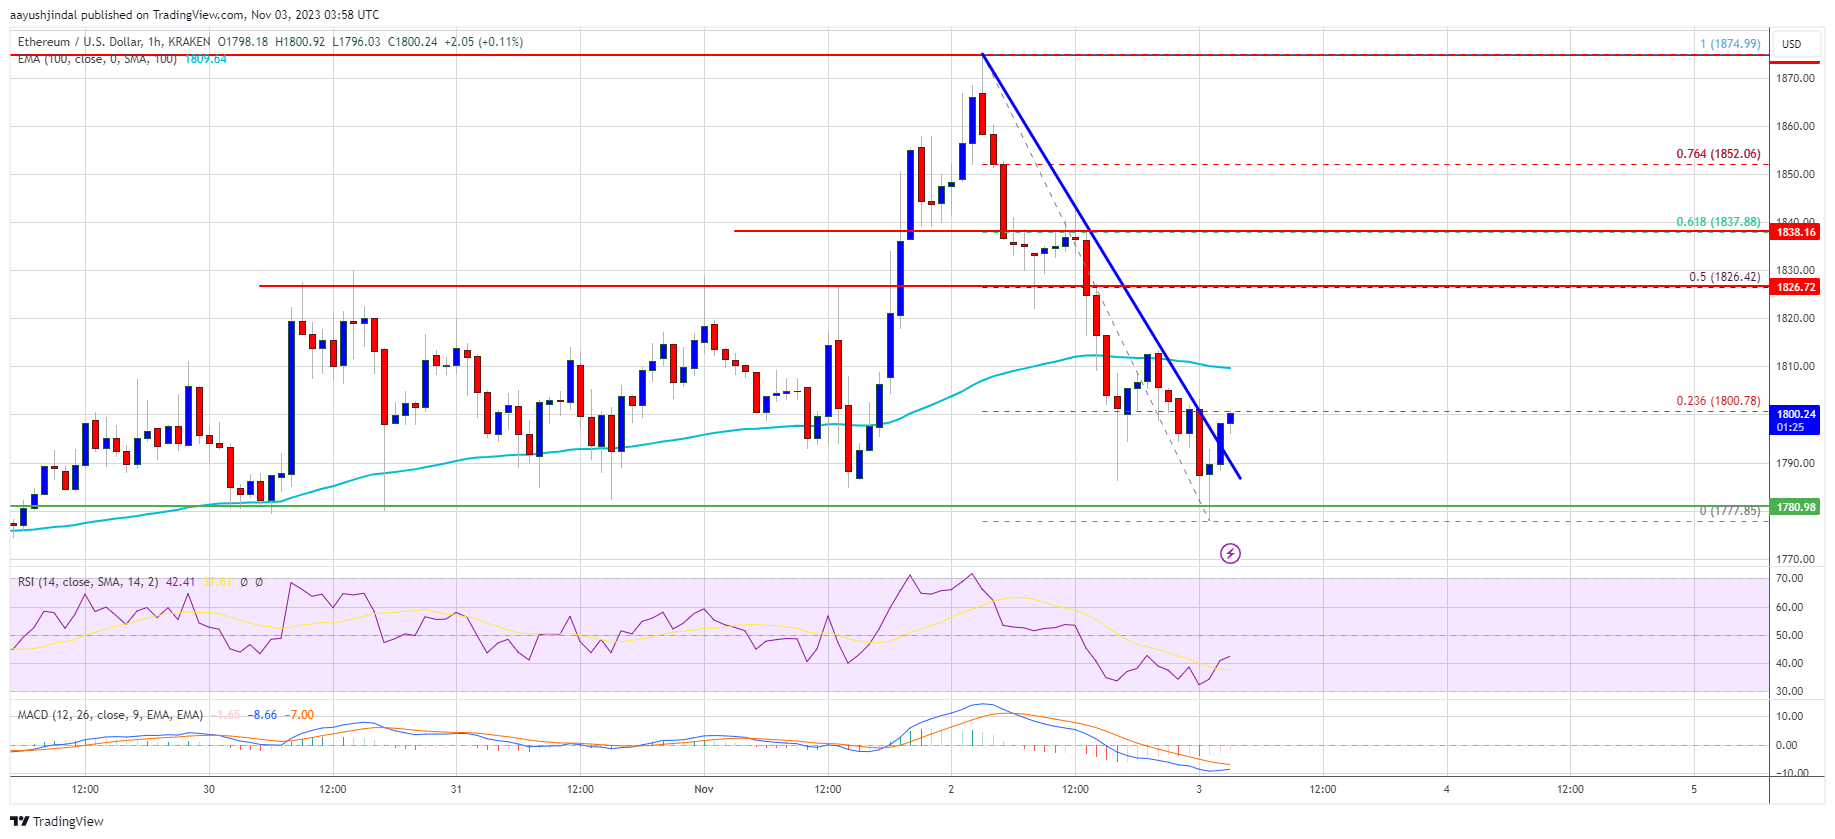
Source: ETHUSD on TradingView.com
If ETH surpasses the $1,825 resistance, it could again start a steady increase and test $1,875. The next key resistance is near $1,920, above which the price could accelerate higher toward the $2,0000 level. Any more gains might call for a move toward the $2,050 level.
More Losses in ETH?
If Ethereum fails to clear the $1,825 resistance, it could continue to move down. Initial support on the downside is near the $1,780 level or the recent low.
The next key support is $1,750. A downside break below the $1,750 support might spark a bearish wave. In the stated case, Ether could drop toward the $1,650 level.
Technical Indicators
Hourly MACD – The MACD for ETH/USD is losing momentum in the bearish zone.
Hourly RSI – The RSI for ETH/USD is now below the 50 level.
Major Support Level – $1,780
Major Resistance Level – $1,825


