
Reason to trust
How Our News is Made
Strict editorial policy that focuses on accuracy, relevance, and impartiality
Ad discliamer
Morbi pretium leo et nisl aliquam mollis. Quisque arcu lorem, ultricies quis pellentesque nec, ullamcorper eu odio.
Ethereum was able to clear the $1,700 resistance against the US Dollar. ETH failed to stay above $1,700 and is currently struggling to continue higher.
- Ethereum was able to slowly move higher above $1,650 and $1,700.
- The price is now trading above $1,655 and the 100 hourly simple moving average.
- There is a crucial rising channel forming with support near $1,670 on the hourly chart of ETH/USD (data feed via Kraken).
- The pair could continue to move up if it stays above the $1,655 support zone.
Ethereum Price Tops Near $1,700
Ethereum started an upside correction above the $1,650 resistance zone. ETH climbed above the $1,660 and $1,675 levels to move into a short-term positive zone.
There was a spike above the $1,700 level and a close above the 100 hourly simple moving average. Ether price even moved a few points above the 50% Fib retracement level of the key decline from the $1,880 swing high to $1,525 low.
However, the bulls failed to stay above the $1,700 resistance zone. It is now moving lower below $1,680. There is also a crucial rising channel forming with support near $1,670 on the hourly chart of ETH/USD.
An immediate resistance on the upside is near the $1,700 level. The first major resistance is now forming near the $1,720 level. The next major resistance is near the $1,745 level. It is near the 61.8% Fib retracement level of the key decline from the $1,880 swing high to $1,525 low.
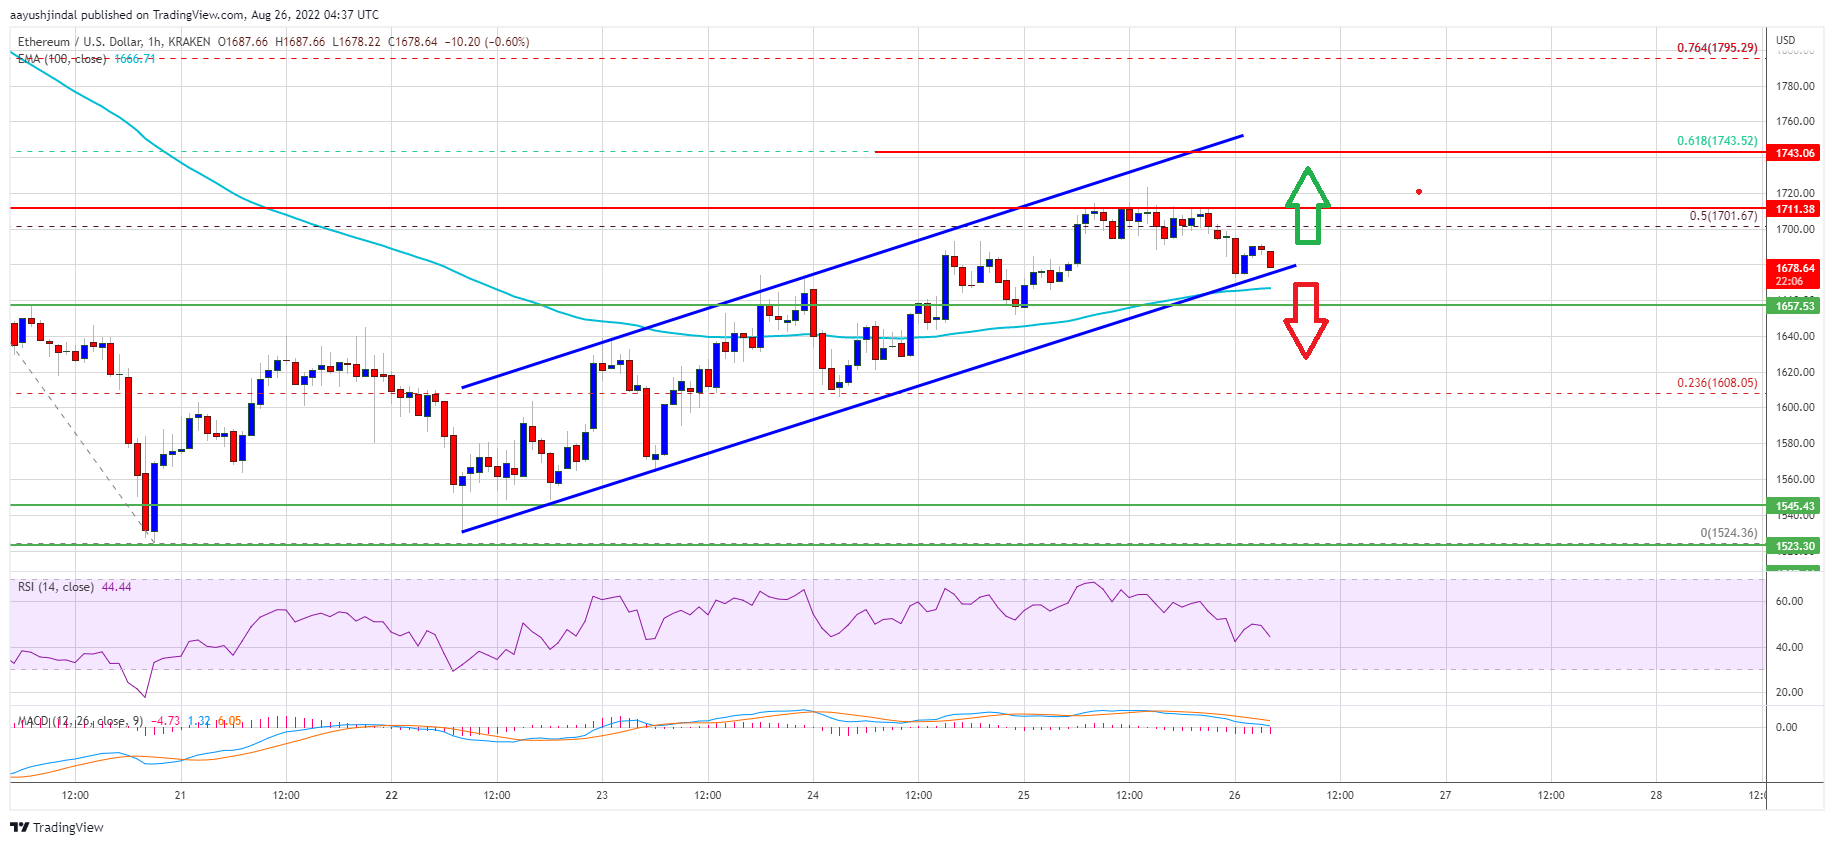
Source: ETHUSD on TradingView.com
A clear move above the $1,745 level might send the price towards $1,800 resistance. Any more gains may perhaps open the doors for a test of the $1,850 resistance.
Fresh Decline in ETH?
If ethereum fails to rise above the $1,720 resistance, it could start a fresh decline. An initial support on the downside is near the $1,670 zone and the channel trend line.
The next major support is near $1,655 and the 100 hourly simple moving average, below which ether price might accelerate lower. In the stated case, the price may perhaps decline towards the $1,600 level. Any more losses may perhaps send the price towards the $1,550 level.
Technical Indicators
Hourly MACD – The MACD for ETH/USD is now losing momentum in the bullish zone.
Hourly RSI – The RSI for ETH/USD is now below the 50 level.
Major Support Level – $1,655
Major Resistance Level – $1,720


