
Reason to trust
How Our News is Made
Strict editorial policy that focuses on accuracy, relevance, and impartiality
Ad discliamer
Morbi pretium leo et nisl aliquam mollis. Quisque arcu lorem, ultricies quis pellentesque nec, ullamcorper eu odio.
Ethereum started a downside correction from the $2,000 resistance against the US Dollar. ETH is consolidating and might decline further towards $1,810.
- Ethereum started a downside correction below the $1,950 level.
- The price is now trading below $1,950 and the 100 hourly simple moving average.
- There was a break below a connecting bullish trend line with support near $1,925 on the hourly chart of ETH/USD (data feed via Kraken).
- The pair could continue to decline if it stays below the $1,950 pivot level.
Ethereum Price Dips
Ethereum made a couple of attempts to gain strength above the $2,000 resistance zone. However, ETH failed to extend gains and started a downside correction below the $1,950 level.
There was a clear move below the $1,920 level and the 100 hourly simple moving average. Besides, there was a break below a connecting bullish trend line with support near $1,925 on the hourly chart of ETH/USD. Ether price even declined below the $1,900 level.
A low is formed near $1,862 and the price is now consolidating losses. It is now trading below $1,950 and the 100 hourly simple moving average.
An immediate resistance on the upside is near the $1,900 level. It is near the 23.6% Fib retracement level of the recent decline from the $2,030 swing high to $1,862 low. The first major resistance is near the $1,945 and $1,950 levels.
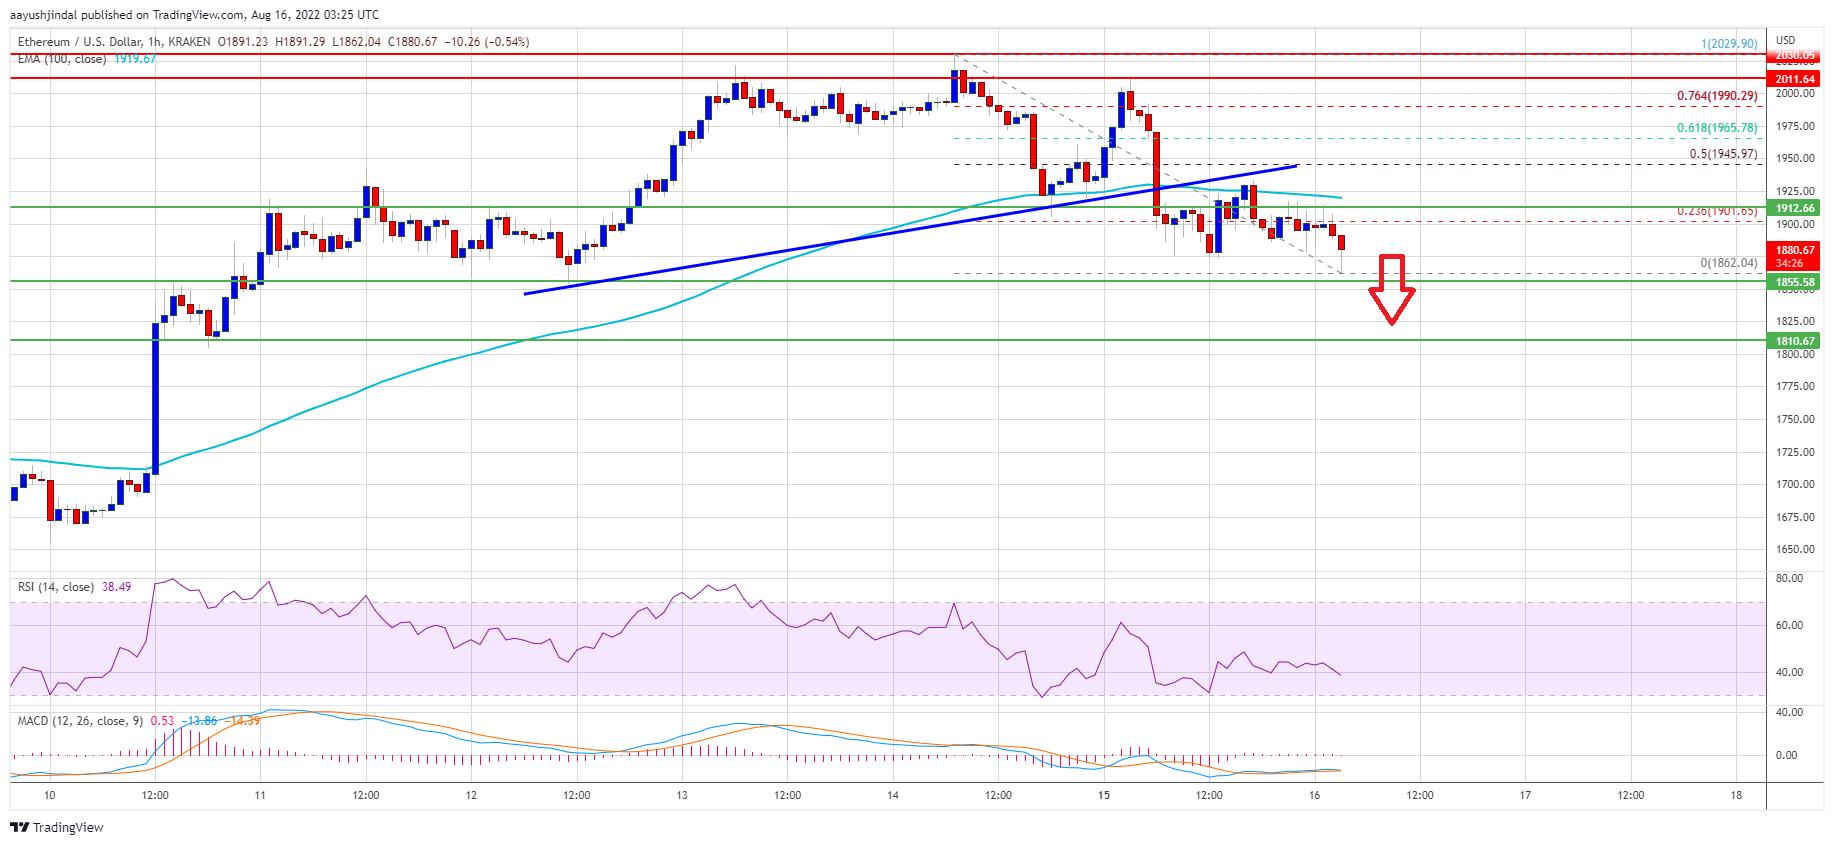
Source: ETHUSD on TradingView.com
The 50% Fib retracement level of the recent decline from the $2,030 swing high to $1,862 low is also near the $1,950 level to act as key resistance. A clear move above the $1,950 level could start a steady increase to $2,000. If there are more upsides, the price may perhaps rise towards the $2,080 resistance zone in the near term.
More Losses in ETH?
If ethereum fails to rise above the $1,950 resistance, it could continue to move down. An initial support on the downside is near the $1,862 zone.
The next major support is near $1,850, below which there is a risk of a move towards the $1,810 level. If the bears remain in action, the price could even decline towards the $1,720 level.
Technical Indicators
Hourly MACD – The MACD for ETH/USD is now losing momentum in the bullish zone.
Hourly RSI – The RSI for ETH/USD is now below the 50 level.
Major Support Level – $1,860
Major Resistance Level – $1,950


