
Reason to trust
How Our News is Made
Strict editorial policy that focuses on accuracy, relevance, and impartiality
Ad discliamer
Morbi pretium leo et nisl aliquam mollis. Quisque arcu lorem, ultricies quis pellentesque nec, ullamcorper eu odio.
Ethereum is trading nicely above the key $140 support zone against the US Dollar. ETH price is showing a few positive signs and it could attempt to rally above $145.
- Ethereum is currently consolidating above the $140 support area against the US Dollar.
- The price is still struggling to gain bullish momentum above the $145 resistance.
- There was a break above a major bearish trend line with resistance near $142 on the hourly chart of ETH/USD (data feed via Kraken).
- The pair could start a strong increase as long as it is above the $140 support and the 100 hourly SMA.
Ethereum Price Could Rally Soon
Recently, Ethereum made another attempt to surpass the $145 resistance against the US Dollar, but it failed. ETH price formed a swing high near the $146 level and declined below $142.
However, the decline was protected by the main $140 support and 100 hourly simple moving average. The price is currently rising and trading nicely above the $142 level.
There was a break above the 50% Fib retracement level of the recent decline from the $146 swing high to $140 low. More importantly, there was a break above a major bearish trend line with resistance near $142 on the hourly chart of ETH/USD.
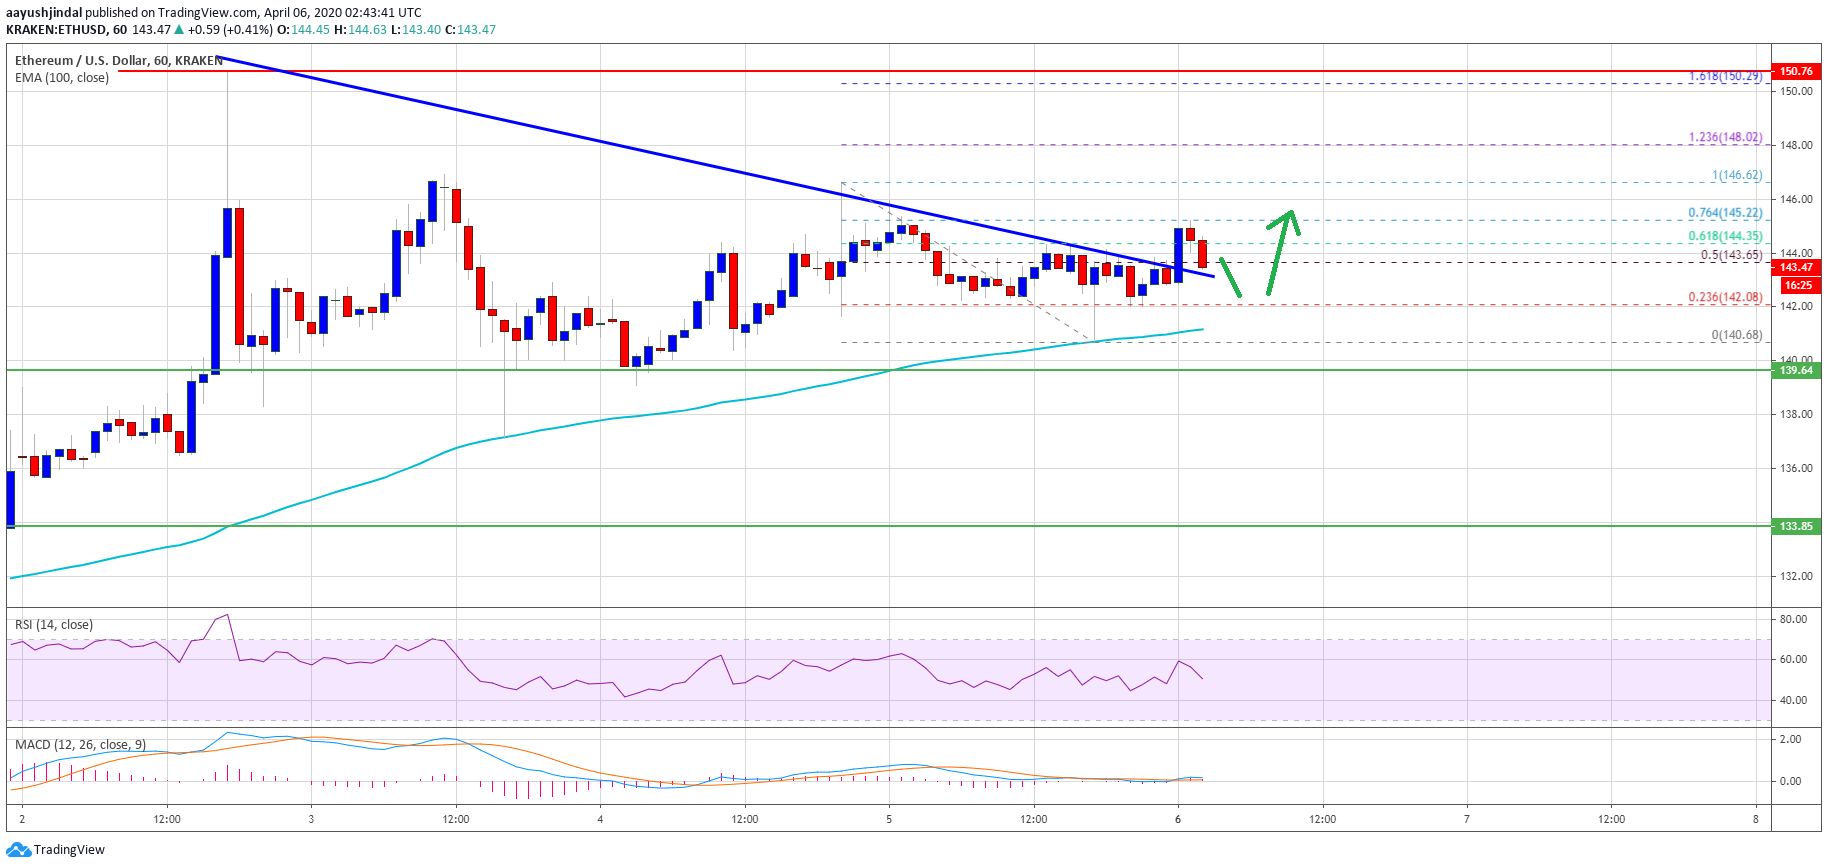
Ethereum tested the $145 resistance once again, but failed to extend its rise. It seems like the 76.4% Fib retracement level of the recent decline from the $146 swing high to $140 low is currently protecting an upside break.
If there is a clear break and close above the $145 resistance, the price could rise steadily above the $148 level. The next stop for the bulls could be near the $150 resistance, above which the price is likely to grind towards the $155 and $158 levels in the near term.
Dips Remain Supported
On the downside, Ethereum is likely to remain well bid above the $140 support area and the 100 hourly simple moving average. If the price fails to stay above the $140 support, it could start a nasty decline.
The next support is near the $135 level, below which there is a risk of a downside extension towards the main $124 support zone.
Technical Indicators
Hourly MACD – The MACD for ETH/USD is slowly moving in the bullish zone.
Hourly RSI – The RSI for ETH/USD is currently declining and approaching the 50 level.
Major Support Level – $140
Major Resistance Level – $145
Take advantage of the trading opportunities with Plus500
Risk disclaimer: 76.4% of retail CFD accounts lose money.


