
Reason to trust
How Our News is Made
Strict editorial policy that focuses on accuracy, relevance, and impartiality
Ad discliamer
Morbi pretium leo et nisl aliquam mollis. Quisque arcu lorem, ultricies quis pellentesque nec, ullamcorper eu odio.
- ETH price declined heavily and broke the key $185 and $180 supports against the US Dollar.
- The price is currently correcting higher and is trading near the $172 and $175 resistances.
- There is a major bearish trend line forming with resistance near $180 on the 4-hours chart of ETH/USD (data feed via Kraken).
- There could be a short term upside correction, but upsides are likely to be capped near $180.
Ethereum price is trading in a bearish zone against the US Dollar and bitcoin. ETH might correct higher in the short-term, but the bulls are likely to struggle near $180-$182.
Ethereum Price Weekly Analysis
This past week, there was a strong decline in bitcoin and ETH below $10,000 and $180 respectively against the US Dollar. Ether price even declined below the $175 support and the 100 simple moving average (4-hours). Moreover, there was a break below the $170 support and the price traded close to the $163 level. Recently, the price started an upside correction from the $163 swing low.
It climbed above the $170 level plus the 23.6% Fib retracement level of the recent drop from the $195 high to $163 swing low. However, there are many hurdles on the upside near the $178 and $180 levels. Moreover, there is a major bearish trend line forming with resistance near $180 on the 4-hours chart of ETH/USD. The trend line is close to the 50% Fib retracement level of the recent drop from the $195 high to $163 swing low.
Above the trend line, the next major resistance is near the $184 level and the 100 SMA. The 61.8% Fib retracement level of the recent drop from the $195 high to $163 swing low is also waiting near the $182 zone to act as a resistance. Therefore, the price must climb above $180, $182 and $184 to move back into a positive zone in the near term.
On the downside, an immediate support is near the $165 level. If the price fails to stay above the $165 support area, there is a risk of more downsides in the near term. In the mentioned bearish case, the price could even decline below the $160 support level.
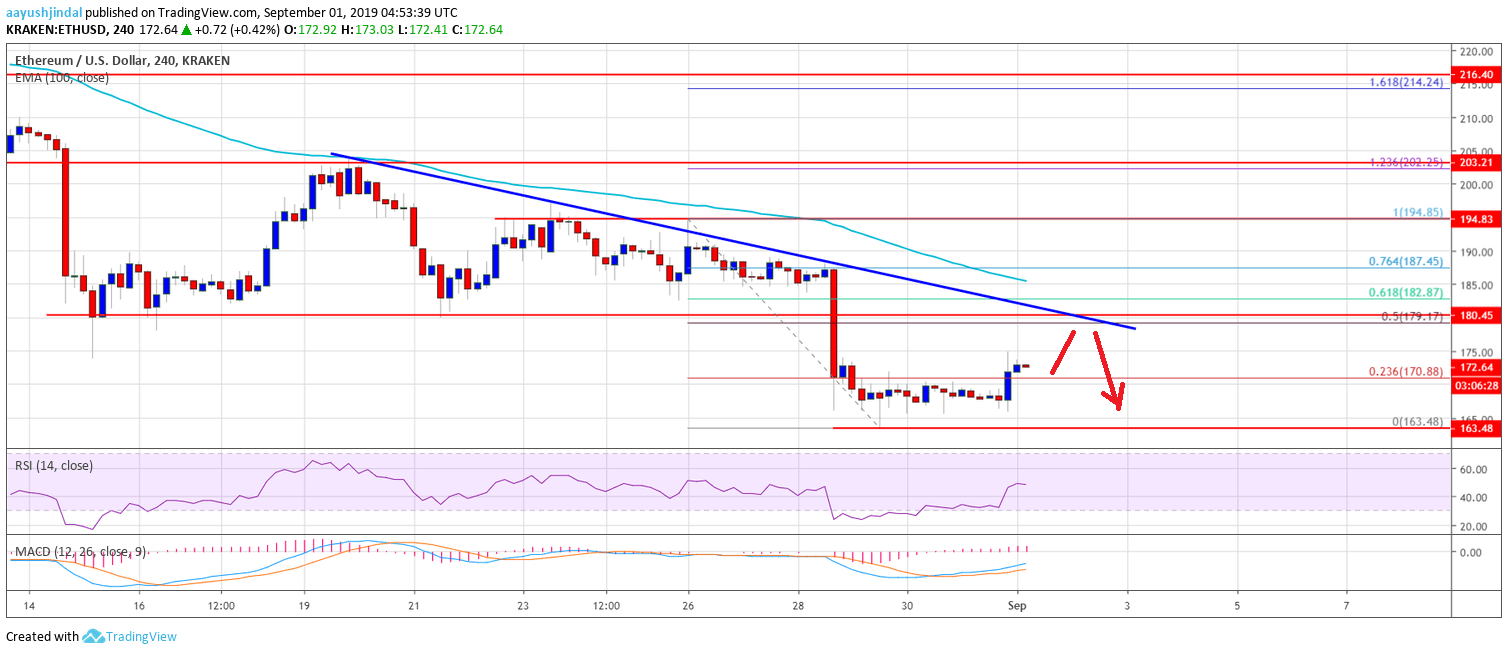
The above chart indicates that Ethereum price is clearly trading in a bearish zone below the $180 level. If there is an upside correction towards the $180 level, the bears are likely to defend further upsides.
Technical Indicators
4 hours MACD – The MACD for ETH/USD is slowly gaining momentum in the bullish zone.
4 hours RSI – The RSI for ETH/USD is currently just above the 50 level, with a positive angle.
Major Support Level – $165
Major Resistance Level – $180


