Key Highlights
- ETH price made a nice upside move towards $13.50 against the US Dollar.
- There was a break above a monster resistance area at $11.42 on the daily chart (data feed via SimpleFX) of ETH/USD.
- On the downside, there is a bullish trend line, which may act as a support if the pair dips towards $11.50.
Ethereum price is back in the bullish zone against the US Dollar with a close above $13.00. More gains are possible in ETH/USD moving ahead.
Ethereum Price Upside Break
These past 2-3 days were good for Ethereum price, as it managed to clear a couple of important resistance levels like $11.40 against the US Dollar. The price gained pace once there was a break and managed to settle above the $13.00 handle as well. These all are positive signs, and suggest a positive momentum for the price. It looks like the price may continue to trade higher, and could even break the recent high of $13.60.
On the downside, an initial support on the daily chart is at $12.80. It coincides with the 23.6% fib retracement level of the last wave from the $10.24 low to $13.60 high. So, if the price dips from the current levels, it may find support near $13.00 and $12.80. Furthermore, at $11.50, there is a bullish trend line on the daily chart (data feed via SimpleFX) of ETH/USD. It also coincides with the recent broken resistance at $11.45.
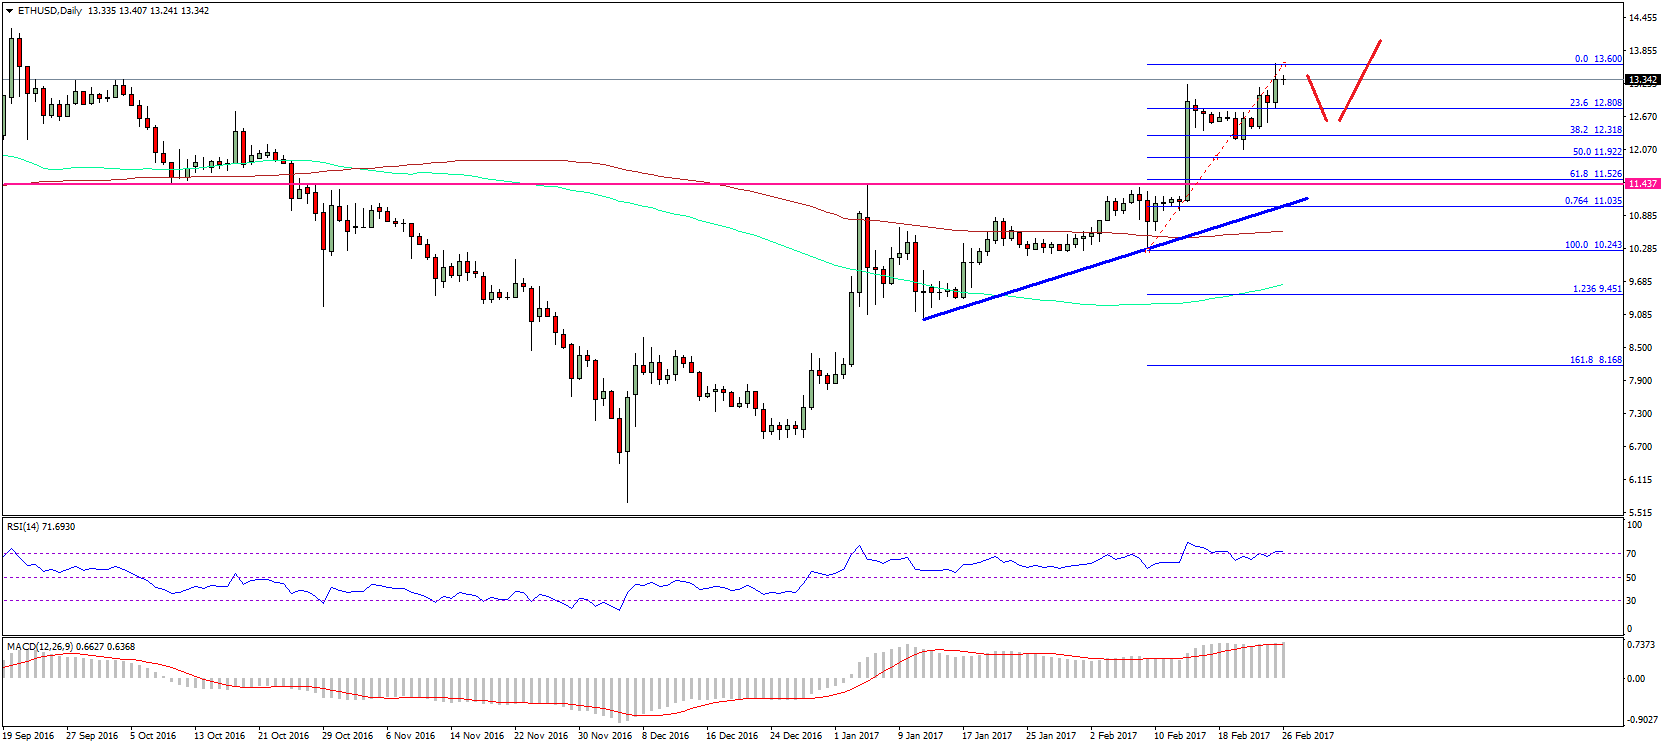
So, we can say that there are many support levels on the downside for ETH/USD, and it may bids if corrects lower. If you are a buyer, watch for dips near $13.00 and $12.50. On the upside, a break above $13.60 could take the price towards $14.00.
Daily MACD – The MACD is in the bullish zone with positive signs.
Daily RSI – The RSI is moving into the overbought levels.
Major Support Level – $12.80
Major Resistance Level – $13.60
Charts courtesy – SimpleFX